
Nutrient Intake during Pregnancy and Adherence to Dietary Recommendations: The Mediterranean PHIME Cohort

 , , , , , , ,
Abstract
:1. Introduction
2. Materials and Methods
2.1. Study Population
2.2. Maternal Dietary Assessment during Pregnancy and BMI Status
2.3. Nutrients
2.4. Ethics
2.5. Statistics
3. Results
4. Discussion
5. Conclusions
Supplementary Materials
Author Contributions
Funding
Institutional Review Board Statement
Informed Consent Statement
Data Availability Statement
Acknowledgments
Conflicts of Interest
References
- Berti, C.; Cetin, I.; Agostoni, C.; Desoye, G.; Devlieger, R.; Emmett, P.M.; Ensenauer, R.; Hauner, H.; Herrera, E.; Hoesli, I.; et al. Pregnancy and Infants’ Outcome: Nutritional and Metabolic Implications. Crit. Rev. Food Sci. Nutr. 2014, 56, 82–91. [Google Scholar] [CrossRef]
- IOM (Institute of Medicine); NRC (National Research Council). Weight Gain during Pregnancy: Reexamination the Guidelines; The National Academies Press: Washington, DC, USA, 2009. [Google Scholar]
- Golab, B.P.; Santos, S.; Voerman, E.A.; Lawlor, D.; Jaddoe, V.W.V.; Gaillard, R.; Barros, H.; Bergström, A.; Charles, M.-A.; Chatzi, L.; et al. Influence of maternal obesity on the association between common pregnancy complications and risk of childhood obesity: An individual participant data meta-analysis. Lancet Child Adolesc. Health 2018, 2, 812–821. [Google Scholar] [CrossRef] [Green Version]
- Voerman, E.; Santos, S.; Inskip, H.; Amiano, P.; Barros, H.; Charles, M.-A.; Chatzi, L.; Chrousos, G.P.; Corpeleijn, E.; LifeCycle Project-Maternal Obesity and Childhood Outcomes Study Group; et al. Association of Gestational Weight Gain With Adverse Maternal and Infant Outcomes. JAMA 2019, 321, 1702–1715. [Google Scholar] [CrossRef] [PubMed] [Green Version]
- Heslehurst, N.; Vieira, R.; Akhter, Z.; Bailey, H.; Slack, E.; Ngongalah, L.; Pemu, A.; Rankin, J. The association between maternal body mass index and child obesity: A systematic review and meta-analysis. PLoS Med. 2019, 16, e1002817. [Google Scholar] [CrossRef]
- Christian, P.; Mullany, L.C.; Hurley, K.M.; Katz, J.; Black, R.E. Nutrition and maternal, neonatal, and child health. Semin. Perinatol. 2015, 39, 361–372. [Google Scholar] [CrossRef]
- Mousa, A.; Naqash, A.; Lim, S. Macronutrient and Micronutrient Intake during Pregnancy: An Overview of Recent Evidence. Nutrients 2019, 11, 443. [Google Scholar] [CrossRef] [Green Version]
- Saunders, C.M.; Rehbinder, E.M.; Carlsen, K.C.L.; Gudbrandsgard, M.; Carlsen, K.-H.; Haugen, G.; Hedlin, G.; Jonassen, C.M.; Sjøborg, K.D.; Landrø, L.; et al. Food and nutrient intake and adherence to dietary recommendations during pregnancy: A Nordic mother–child population-based cohort. Food Nutr. Res. 2019, 63. [Google Scholar] [CrossRef] [PubMed]
- Marangoni, F.; Cetin, I.; Verduci, E.; Canzone, G.; Giovannini, M.; Scollo, P.; Corsello, G.; Poli, A. Maternal Diet and Nutrient Requirements in Pregnancy and Breastfeeding. An Italian Consensus Document. Nutrients 2016, 8, 629. [Google Scholar] [CrossRef]
- Procter, S.B.; Campbell, C.G. Position of the Academy of Nutrition and Dietetics: Nutrition and Lifestyle for a Healthy Pregnancy Outcome. J. Acad. Nutr. Diet. 2014, 114, 1099–1103. [Google Scholar] [CrossRef] [PubMed]
- Villar-Vidal, M.; Amiano, P.; Rodríguez-Bernal, C.; Marina, L.S.; Mozo, I.; Vioque, J.; Navarrete-Muñoz, E.M.; Romaguera, D.; Valvi, D.; Samoano, A.F.; et al. Compliance of nutritional recommendations of Spanish pregnant women according to sociodemographic and lifestyle characteristics: A cohort study. Nutr. Hosp. 2015, 31, 1803–1812. [Google Scholar]
- Subar, A.F.; Freedman, L.S.; Tooze, J.A.; Kirkpatrick, S.I.; Boushey, C.J.; Neuhouser, M.L.; Thompson, F.E.; Potischman, N.; Guenther, P.M.; Tarasuk, V.; et al. Addressing Current Criticism Regarding the Value of Self-Report Dietary Data. J. Nutr. 2015, 145, 2639–2645. [Google Scholar] [CrossRef] [Green Version]
- Valent, F.; Horvat, M.; Sofianou-Katsoulis, A.; Spiric, Z.; Mazej, D.; Little, D.; Prasouli, A.; Mariuz, M.; Tamburlini, G.; Nakou, S.; et al. Neurodevelopmental Effects of Low-level Prenatal Mercury Exposure From Maternal Fish Consumption in a Mediterranean Cohort: Study Rationale and Design. J. Epidemiol. 2013, 23, 146–152. [Google Scholar] [CrossRef] [Green Version]
- European Food Safety Authority (EFSA). Dietary Reference Values for the EU. Available online: https://www.efsa.europa.eu/en/interactive-pages/drvs (accessed on 15 September 2020).
- Barbone, F.; Rosolen, V.; Mariuz, M.; Parpinel, M.; Casetta, A.; Sammartano, F.; Ronfani, L.; Brumatti, L.V.; Bin, M.; Castriotta, L.; et al. Prenatal mercury exposure and child neurodevelopment outcomes at 18 months: Results from the Mediterranean PHIME cohort. Int. J. Hyg. Environ. Health 2019, 222, 9–21. [Google Scholar] [CrossRef]
- Franceschi, S.; Negri, E.; Salvini, S.; DeCarli, A.; Ferraroni, M.; Filiberti, R.; Giacosa, A.; Talamini, R.; Nanni, O.; Panarello, G.; et al. Reproducibility of an Italian food frequency questionnaire for cancer studies: Results for specific food items. Eur. J. Cancer 1993, 29, 2298–2305. [Google Scholar] [CrossRef]
- Franceschi, S.; Barbone, F.; Negri, E.; DeCarli, A.; Ferraroni, M.; Filiberti, R.; Giacosa, A.; Gnagnarella, P.; Nanni, O.; Salvini, S.; et al. Reproducibility of an Italian food frequency questionnaire for cancer studies. Ann. Epidemiol. 1995, 5, 69–75. [Google Scholar] [CrossRef]
- DeCarli, A.; Franceschi, S.; Ferraroni, M.; Gnagnarella, P.; Parpinel, M.T.; La Vecchia, C.; Negri, E.; Salvini, S.; Falcini, F.; Giacosa, A. Validation of a food-frequency questionnaire to assess dietary intakes in cancer studies in Italy results for specific nutrients. Ann. Epidemiol. 1996, 6, 110–118. [Google Scholar] [CrossRef]
- Willett, W. Nutritional Epidemiology; Oxford University Press: Oxford, UK, 2012; ISBN 9780199754038. [Google Scholar]
- Gilmore, L.A.; Redman, L.M. Weight gain in pregnancy and application of the 2009 IOM guidelines: Toward a uniform approach. Obesity 2015, 23, 507–511. [Google Scholar] [CrossRef]
- Gnagnarella, P.; Salvini, S.; Parpinel, M. Food Composition Database for Epidemiological Studies in Italy. Available online: http://www.bda-ieo.it (accessed on 3 October 2020).
- Talamini, R.; Polesel, J.; Montella, M.; Maso, L.D.; Crovatto, M.; Crispo, A.; Spina, M.; Canzonieri, V.; La Vecchia, C.; Franceschi, S. Food groups and risk of non-Hodgkin lymphoma: A multicenter, case-control study in Italy. Int. J. Cancer 2006, 118, 2871–2876. [Google Scholar] [CrossRef]
- Società Italiana di Nutrizione Umana (SINU). LARN: Livelli di Assunzione di Riferimento di Nutrienti ed Energia per la Popolazione Italiana; SICS: Milano, Italy, 2014; ISBN 9788890685224. [Google Scholar]
- Emmett, P.M.; Jones, L.R.; Northstone, K. Dietary patterns in the Avon Longitudinal Study of Parents and Children. Nutr. Rev. 2015, 73, 207–230. [Google Scholar] [CrossRef]
- Products, N.A.A. (Nda) E.P.O.D. Scientific Opinion on the safety of caffeine. EFSA J. 2015, 13, 13. [Google Scholar] [CrossRef] [Green Version]
- Blumfield, M.L.; Hure, A.J.; MacDonald-Wicks, L.; Smith, R.; Collins, C.E. Systematic review and meta-analysis of energy and macronutrient intakes during pregnancy in developed countries. Nutr. Rev. 2012, 70, 322–336. [Google Scholar] [CrossRef]
- Savard, C.; Lemieux, S.; Weisnagel, S.J.; Fontaine-Bisson, B.; Gagnon, C.; Robitaille, J.; Morisset, A.-S. Trimester-Specific Dietary Intakes in a Sample of French-Canadian Pregnant Women in Comparison with National Nutritional Guidelines. Nutrients 2018, 10, 768. [Google Scholar] [CrossRef] [Green Version]
- Devlieger, R.; Benhalima, K.; Damm, P.; Van Assche, A.; Mathieu, C.; Mahmood, T.; Dunne, F.; Bogaerts, A. Maternal obesity in Europe: Where do we stand and how to move forward? Eur. J. Obstet. Gynecol. Reprod. Biol. 2016, 201, 203–208. [Google Scholar] [CrossRef]
- Poston, L.; Caleyachetty, R.; Cnattingius, S.; Corvalán, C.; Uauy, R.; Herring, S.; Gillman, M.W. Preconceptional and maternal obesity: Epidemiology and health consequences. Lancet Diabetes Endocrinol. 2016, 4, 1025–1036. [Google Scholar] [CrossRef]
- Bellisari, A. Evolutionary origins of obesity. Obes. Rev. 2008, 9, 165–180. [Google Scholar] [CrossRef] [PubMed]
- Bowers, K.; Tobias, D.K.; Yeung, E.; Hu, F.B.; Zhang, C. A prospective study of prepregnancy dietary fat intake and risk of gestational diabetes. Am. J. Clin. Nutr. 2012, 95, 446–453. [Google Scholar] [CrossRef] [Green Version]
- Chia, A.-R.; Chen, L.-W.; Lai, J.S.; Wong, C.H.; Neelakantan, N.; Van Dam, R.M.; Chong, M.F.-F. Maternal Dietary Patterns and Birth Outcomes: A Systematic Review and Meta-Analysis. Adv. Nutr. 2019, 10, 685–695. [Google Scholar] [CrossRef] [Green Version]
- Centro di RicErca Alimenti e NUTrizione. Linee Guida Per Una Sana Alimentazione; Centro di Ricerca Alimenti e Nutrizione: Roma, Italy, 2018; ISBN 9788833850375. [Google Scholar]
- Agodi, A.; Barchitta, M.; Valenti, G.; Quattrocchi, A.; Marchese, A.E.; Conti, G.O.; Fallico, R.; Sciacca, S.; Ferrante, M. Dietary Folate Intake and Blood Biomarkers Reveal High-Risk Groups in a Mediterranean Population of Healthy Women of Childbearing Potential. Ann. Nutr. Metab. 2013, 63, 179–185. [Google Scholar] [CrossRef]
- Dubois, L.; Diasparra, M.; Bédard, B.; Colapinto, C.K.; Fontaine-Bisson, B.; Morisset, A.-S.; Tremblay, R.E.; Fraser, W.D. Adequacy of nutritional intake from food and supplements in a cohort of pregnant women in Québec, Canada: The 3D Cohort Study (Design, Develop, Discover). Am. J. Clin. Nutr. 2017, 106, 541–548. [Google Scholar] [CrossRef]
- Wald, N.J.; Law, M.R.; Morris, J.K.; Wald, D.S. Quantifying the effect of folic acid. Lancet 2001, 358, 2069–2073. [Google Scholar] [CrossRef]
- Dror, D.K. Vitamin D status during pregnancy. Curr. Opin. Obstet. Gynecol. 2011, 23, 422–426. [Google Scholar] [CrossRef] [PubMed]
- Haider, B.A.; Olofin, I.; Wang, M.; Spiegelman, D.; Ezzati, M.; Fawzi, W.W.; on behalf of Nutrition Impact Model Study Group (Anaemia). Anaemia, prenatal iron use, and risk of adverse pregnancy outcomes: Systematic review and meta-analysis. BMJ 2013, 346, f3443. [Google Scholar] [CrossRef] [PubMed] [Green Version]
- World Health Organization (WHO). Weekly Iron-Folic Acid Supplementation (WIFS) in Women of Reproductive Age: Its Role in Promoting Optimal Maternal and Child Health. Position Statement; World Health Organization: Geneva, Switzerland, 2009. [Google Scholar]
- WHO antenatal care recommendations for a positive pregnancy experience. Nutritional Interventions Update: Vitamin D Supplements during Pregnancy; World Health Organization: Geneva, Switzerland, 2020. [Google Scholar]
- Savard, C.; Gagnon, C.; Morisset, A.-S. Disparities in the timing and measurement methods to assess vitamin D status during pregnancy: A Narrative Review. Int. J. Vitam. Nutr. Res. 2018, 88, 176–189. [Google Scholar] [CrossRef]
- Cawley, S.; Mullaney, L.; McKeating, A.; Farren, M.; McCartney, D.; Turner, M.J. A review of European guidelines on periconceptional folic acid supplementation. Eur. J. Clin. Nutr. 2015, 70, 143–154. [Google Scholar] [CrossRef] [PubMed]


| Croatia (n = 136) | Greece (n = 314) | Italy (n = 646) | Slovenia (n = 340) | p-Value 1 | |
|---|---|---|---|---|---|
| Mother’s age at delivery, mean ± SD (median) | 30.2 ± 4.4 (30) | 28.8 ± 6.3 (29) | 33.1 ± 4.3 (33) | 30.4 ± 4.3 (30) | <0.01 |
| Maternal BMI before pregnancy, n (%): | |||||
| Underweight | 8 (5.9) | 19 (6.1) | 47 (7.3) | 8 (2.4) | <0.01 |
| Normal weight | 102 (75.0) | 205 (65.5) | 466 (72.1) | 223 (65.6) | |
| Overweight | 19 (14.0) | 63 (20.1) | 97 (15.0) | 70 (20.6) | |
| Obese | 7 (5.1) | 26 (8.3) | 36 (5.6) | 39 (11.5) | |
| Weight gain during pregnancy, n (%): | |||||
| Insufficient | 15 (11.0) | 80 (26.1) | 136 (25.0) | 74 (22.1) | <0.01 |
| Adequate | 58 (42.7) | 118 (38.6) | 240 (44.1) | 123 (36.7) | |
| Excessive | 63 (46.3) | 108 (35.3) | 168 (30.9) | 138 (41.2) | |
| Mother’s occupation, n (%): | |||||
| Employed | 121 (91.7) | 139 (44.4) | 546 (85.5) | 301 (89.1) | <0.01 |
| Unemployed | 11 (8.3) | 174 (55.6) | 93 (14.6) | 37 (10.9) | |
| Mothers’ marital status, n (%): | |||||
| Married or living together | 133 (97.8) | 311 (99.4) | 575 (89.8) | 328 (97.0) | <0.01 |
| Widow, single, never married, separated or divorced | 3 (2.2) | 2 (0.6) | 65 (10.2) | 10 (3.0) | |
| Mother’s educational level, n (%): | |||||
| Elementary or middle school | 74 (54.8) | 75 (24.0) | 107 (16.6) | 38 (11.2) | <0.01 |
| High school or university degree | 61 (45.2) | 238 (76.0) | 537 (83.4) | 300 (88.8) | |
| Cigarettes smoked during pregnancy, mean ± SD (median) | 131.9 ± 465.9 (0) | 215.2 ± 742.8 (0) | 163.3 ± 598.1 (0) | 193.6 ± 691.5 (0) | 0.39 |
| Use of vitamins or supplements 2 during pregnancy, n (%): | |||||
| Yes | 106 (81.5) | 273 (87.2) | 471 (73.8) | 282 (83.7) | <0.01 |
| No | 24 (18.5) | 40 (12.8) | 167 (26.8) | 55 (16.3) | |
| Use of folic acid before pregnancy, n (%): | |||||
| Yes | 27 (19.8) | 18 (5.7) | 252 (39.0) | 154 (42.3) | |
| No | 109 (80.2) | 296 (94.3) | 394 (61.0) | 186 (54.7) | <0.01 |
| Child’s gender, n (%): | |||||
| Male | 61 (44.9) | 141 (45.2) | 329 (50.9) | 165 (48.7) | 0.31 |
| Female | 75 (55.2) | 171 (54.8) | 317 (49.1) | 174 (51.3) | |
| Birth weight (g), mean ± SD (median) | 3549.9 ± 389.9 (3580) | 3326.1 ± 429.2 (3300) | 3411.5 ± 446.4 (3400) | 3455.1 ± 502.9 (3467.5) | <0.01 |
| Length (cm), mean ± SD (median) | 51.2 ± 2.1 (51.0) | 50.2 ± 2.1 (50.0) | 50.1 ± 2.0 (50.0) | 51.7 ± 3.5 (52.0) | <0.01 |
| Macronutrients | Country | Mean | SD | Median | IQR | p-Value 1 | DRV | % of Women below the DRV | % of Women within the DRV | % of Women above the DRV |
|---|---|---|---|---|---|---|---|---|---|---|
| Available Carbohydrates (g/day) | C | 284.4 | 87.4 | 281.2 | 236.9–361.6 | <0.01 | 45–60 E% 2 | 19.1 | 75.7 | 5.2 |
| G | 261.9 | 85.5 | 251.3 | 209.2–339.4 | 35.7 | 61.5 | 2.9 | |||
| I | 292.8 | 85.5 | 284.3 | 244.5–372.4 | 16.7 | 77.7 | 5.6 | |||
| S | 269.3 | 80.3 | 256.8 | 219.4–350.4 | 16.5 | 79.4 | 4.1 | |||
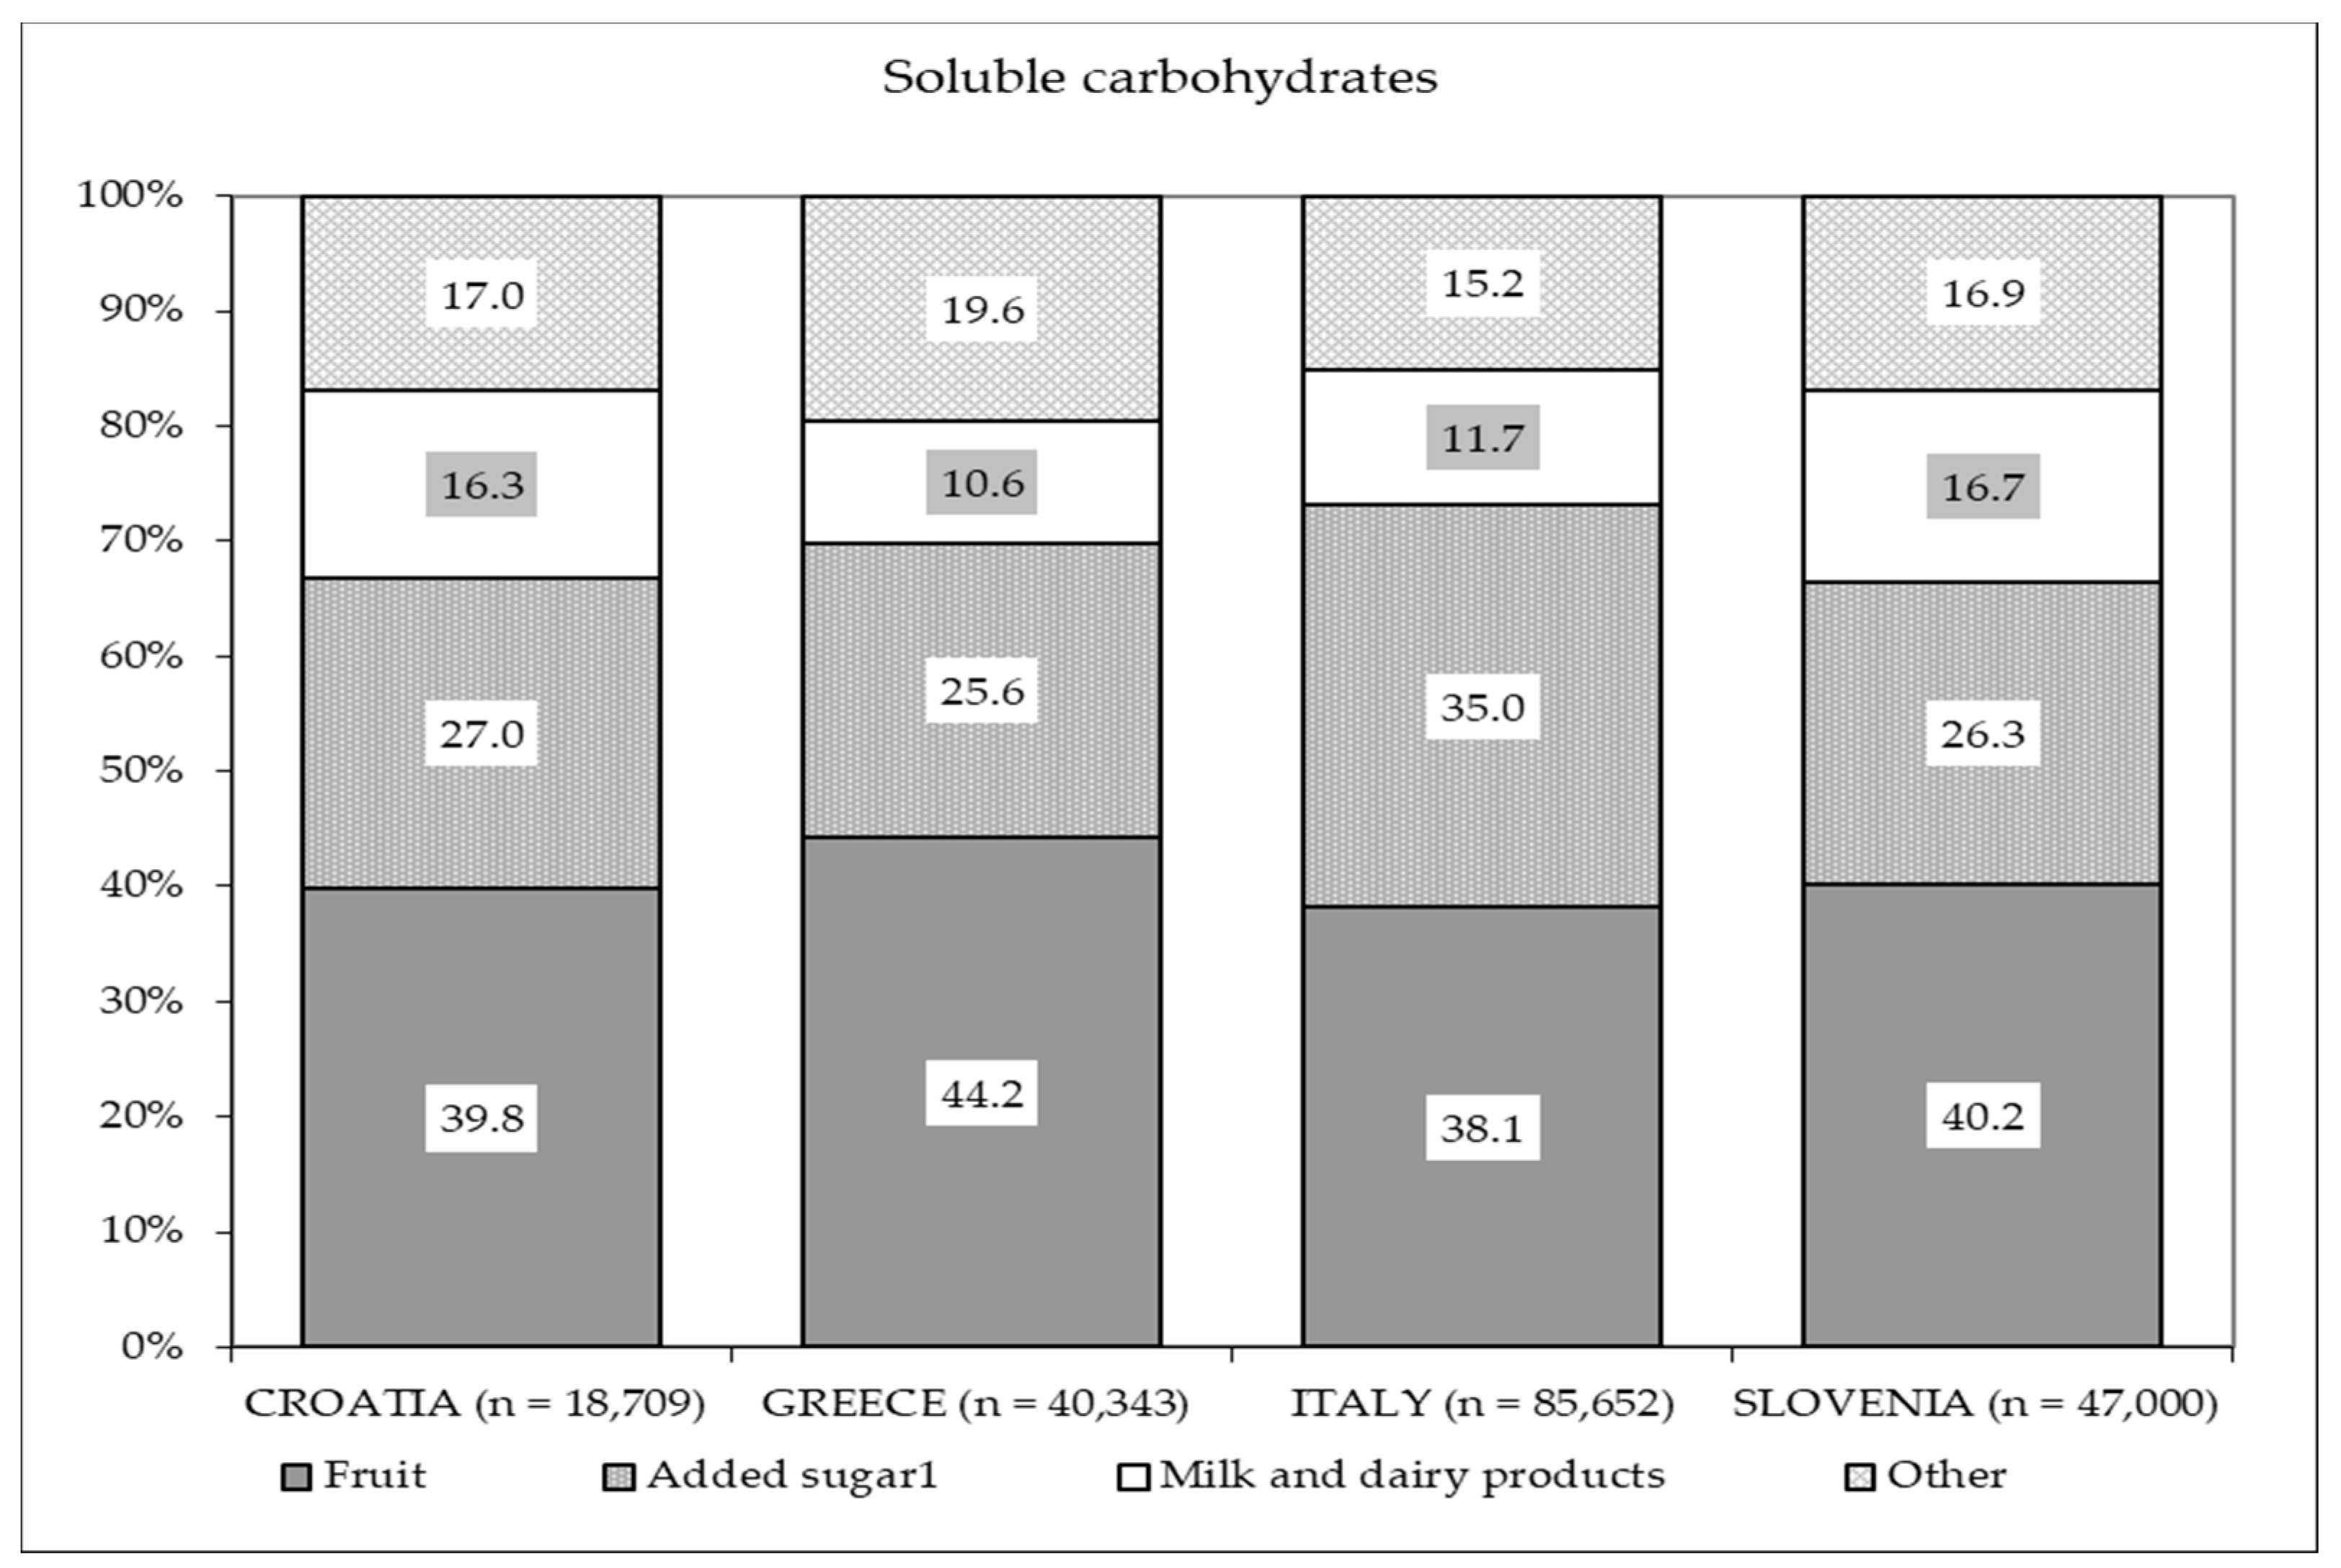
| Soluble Carbohydrates (g/day) | C | 137.6 | 57.3 | 134.6 | 98.6–176.8 | 0.11 | 15 E% 3 | 12.5 | - | 87.5 |
| G | 128.5 | 54.2 | 127.7 | 88.3–166.8 | 13.7 | - | 86.3 | |||
| I | 132.6 | 52.0 | 125.1 | 99.2–165.2 | 10.2 | - | 89.8 | |||
| S | 138.2 | 51.5 | 128.9 | 105.4–180.8 | 2.1 | - | 97.9 | |||
| Fiber (g/day) | C | 29.2 | 11.3 | 28.2 | 23.0–34.4 | <0.01 | 25 g/day 4 | 35.3 | - | 64.7 |
| G | 30.9 | 11.7 | 29.7 | 23.2–41.6 | 32.2 | - | 67.8 | |||
| I | 27.7 | 10.9 | 26.2 | 21.5–36.6 | 46.0 | - | 54.0 | |||
| S | 29.8 | 11.2 | 28.3 | 23.4–39.2 | 38.8 | - | 61.2 | |||
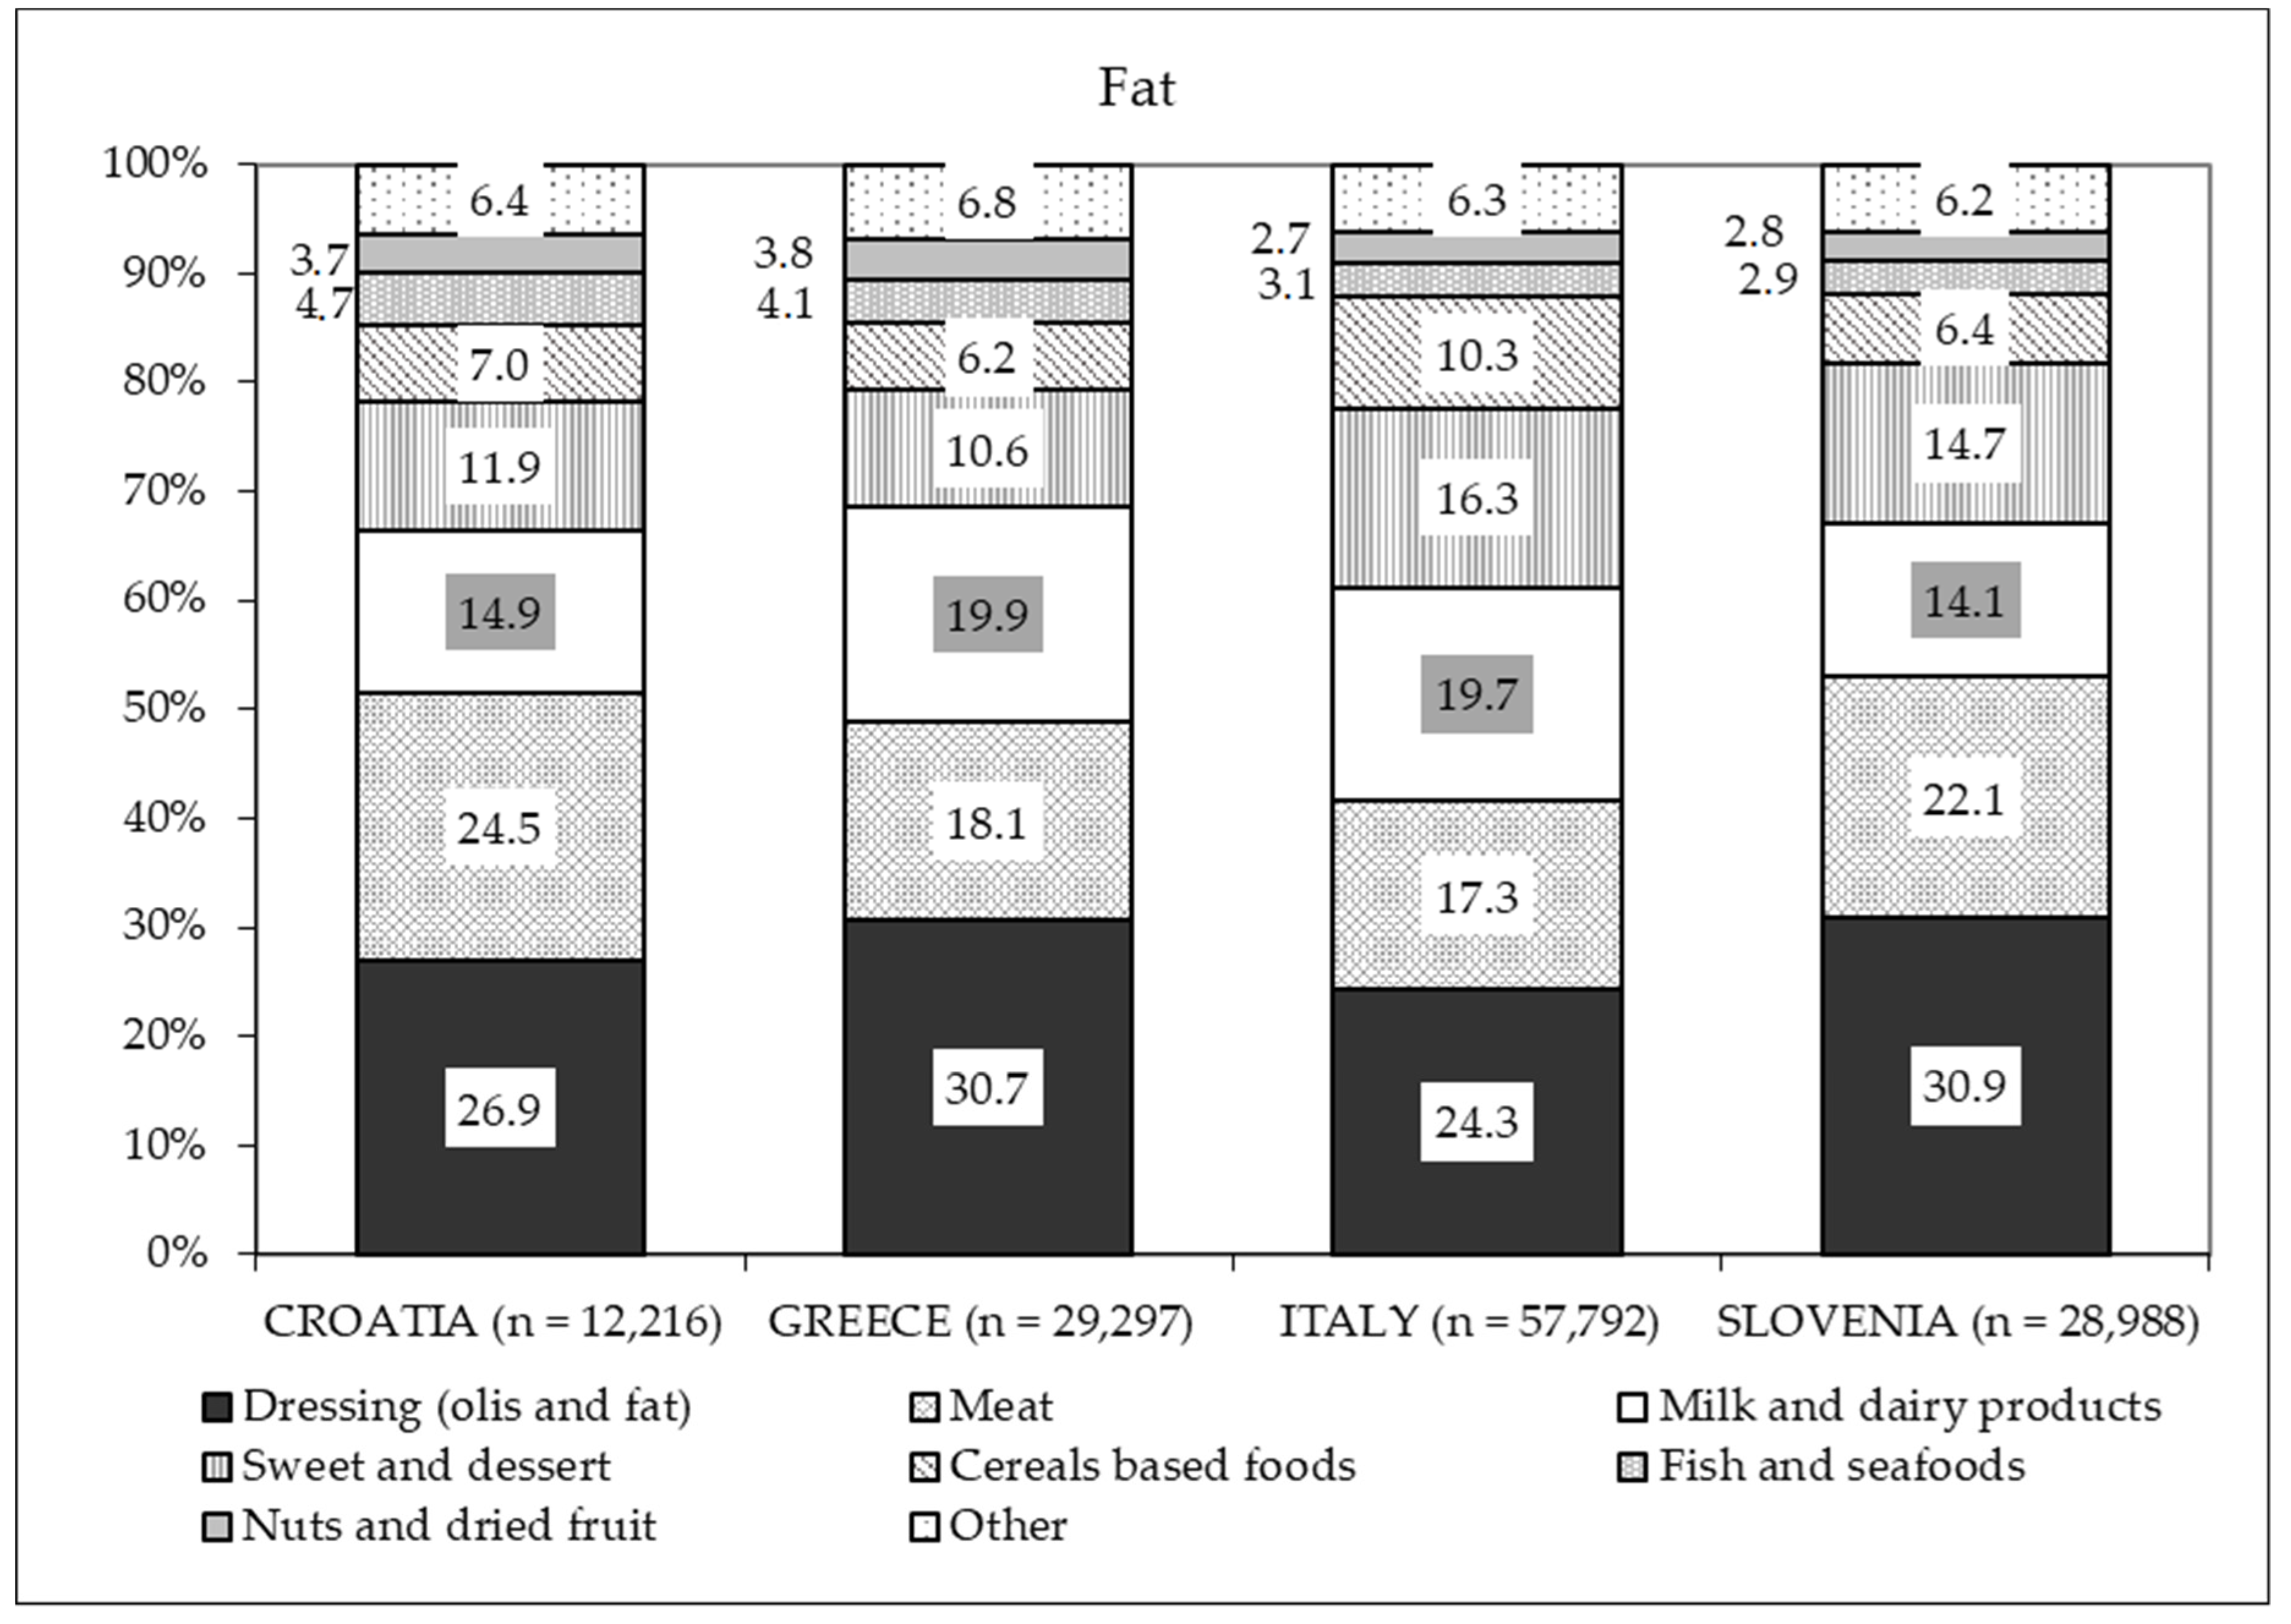
| Total Fat (g/day) | C | 89.8 | 29.8 | 84.0 | 72.9–118.2 | <0.01 | 20–35 E% 2 | 0 | 48.5 | 51.5 |
| G | 93.3 | 31.9 | 92.1 | 73.9–119.6 | 0 | 28.0 | 72.0 | |||
| I | 89.5 | 27.1 | 86.0 | 73.7–114.7 | 0 | 52.2 | 47.8 | |||
| S | 85.3 | 25.8 | 81.6 | 71.3–109.3 | 0.6 | 41.5 | 57.9 | |||
| Protein (g/day) | C | 91.5 | 29.2 | 88.1 | 74.4–117.3 | <0.01 | 10–20 E% 2 | 0 | 95.6 | 4.4 |
| G | 83.9 | 26.7 | 81.7 | 65.1–105.0 | 0 | 95.9 | 4.1 | |||
| I | 87.1 | 24.8 | 85.0 | 72.8–109.8 | 0.3 | 97.5 | 2.2 | |||
| S | 80.5 | 25.9 | 77.4 | 64.2–101.8 | 0.9 | 96.8 | 2.4 |
| Fat | Country | Mean | SD | Median | IQR | p-Value 1 | DRV | % of Women below the DRV | % of Women within the DRV | % of Women above the DRV |
|---|---|---|---|---|---|---|---|---|---|---|
| MUFA (g/day) | C | 36.8 | 12.4 | 34.2 | 30.2–49.2 | <0.01 | 10–15 E% 2 | 2.2 | 61.0 | 36.8 |
| G | 38.7 | 12.9 | 38.7 | 30.4–50.4 | 1.3 | 36.3 | 62.4 | |||
| I | 36.8 | 11.3 | 35.5 | 30.5–47.5 | 1.1 | 63.5 | 35.5 | |||
| S | 35.3 | 11.0 | 34.1 | 29.9–45.1 | 1.2 | 53.8 | 45.0 | |||
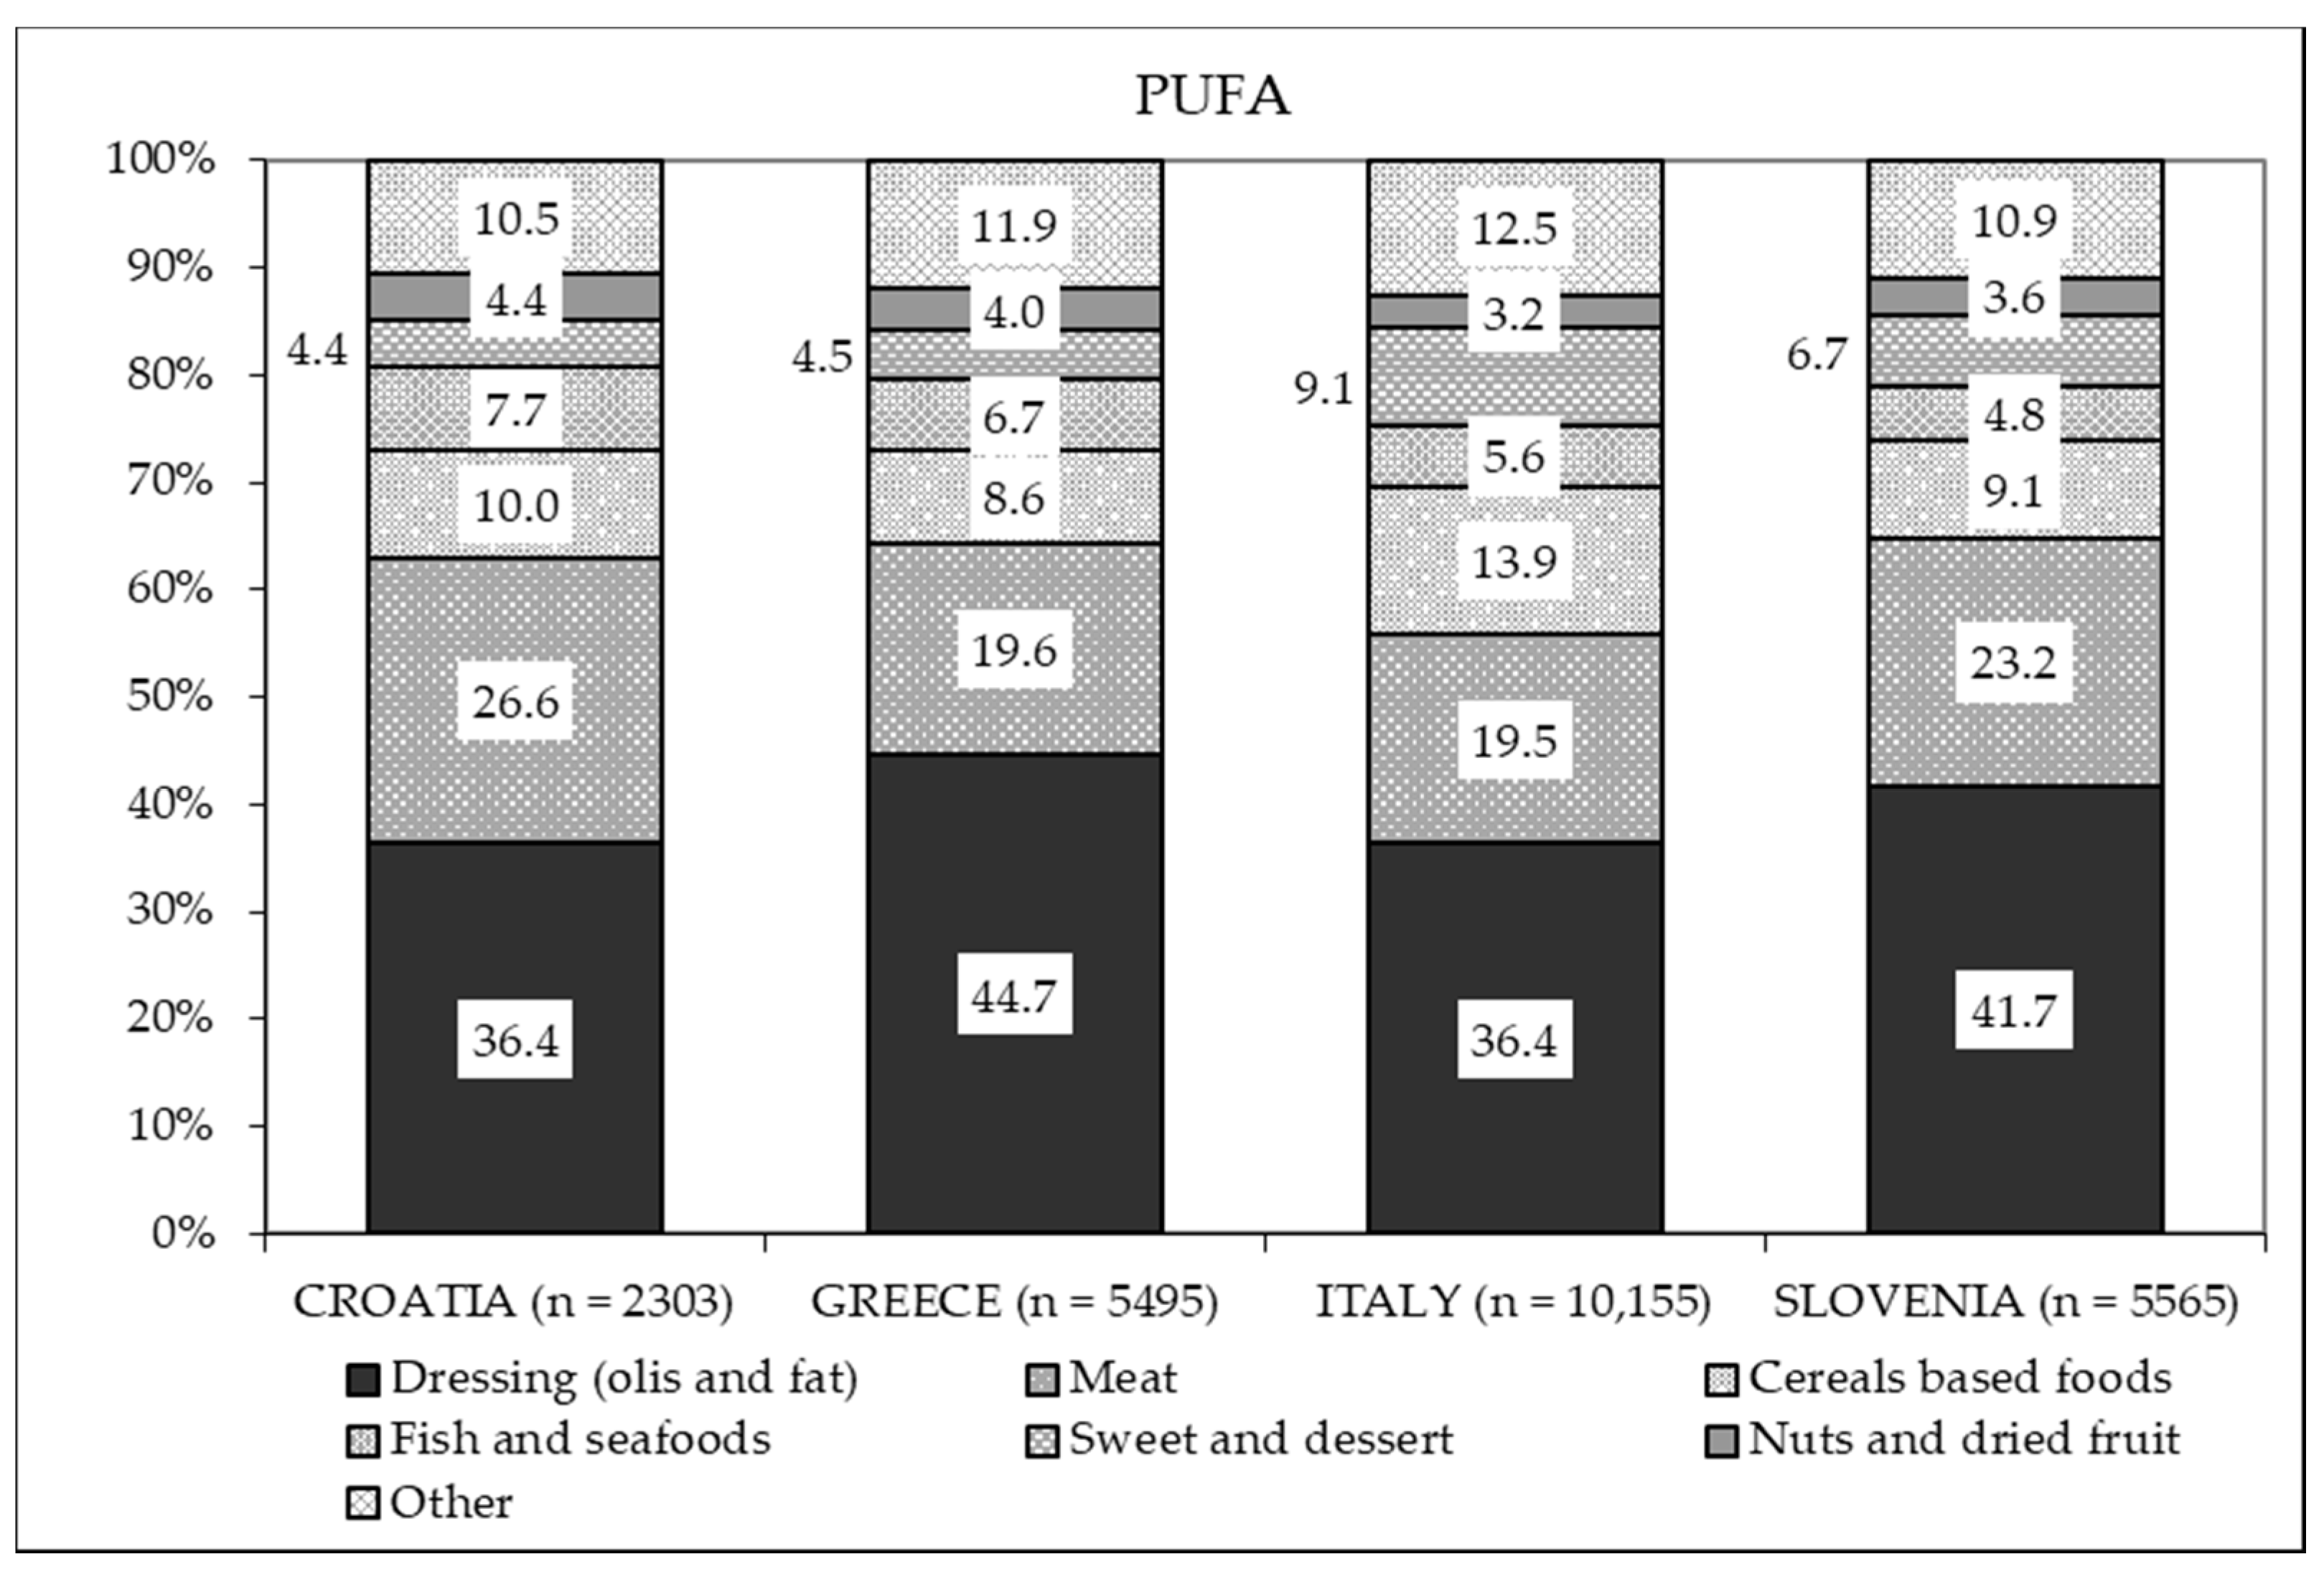
| PUFA (g/day) | C | 16.9 | 5.6 | 16.5 | 13.8–22.6 | <0.01 | 5–10 E% 2 | 4.4 | 94.9 | 0.7 |
| G | 17.5 | 5.7 | 17.5 | 14.0–23.9 | 3.5 | 93.6 | 2.9 | |||
| I | 15.7 | 5.3 | 15.1 | 12.7–20.3 | 17.0 | 82.2 | 0.8 | |||
| S | 16.4 | 5.4 | 15.8 | 13.7–20.8 | 6.2 | 92.7 | 1.2 | |||
| Linoleic Acid (g/day) | C | 13.7 | 4.6 | 13.6 | 11.1–18.0 | <0.01 | 4 E% 3 | 4.4 | - | 95.6 |
| G | 14.5 | 4.8 | 14.4 | 11.9–19.8 | 3.2 | - | 96.8 | |||
| I | 13.0 | 4.5 | 12.4 | 10.5–16.8 | 15.0 | - | 85.0 | |||
| S | 13.6 | 4.6 | 13.1 | 11.4–17.4 | 5.3 | - | 94.7 | |||
| α-linoleic Acid (g/day) | C | 1.8 | 0.6 | 1.8 | 1.5–2.4 | <0.01 | 0.5 E% 3 | 2.2 | - | 97.8 |
| G | 1.9 | 0.6 | 1.9 | 1.5–2.5 | 1.0 | - | 99.0 | |||
| I | 1.7 | 0.6 | 1.6 | 1.4–2.2 | 7.9 | - | 92.1 | |||
| S | 1.8 | 0.6 | 1.7 | 1.5–2.2 | 2.4 | - | 97.4 | |||
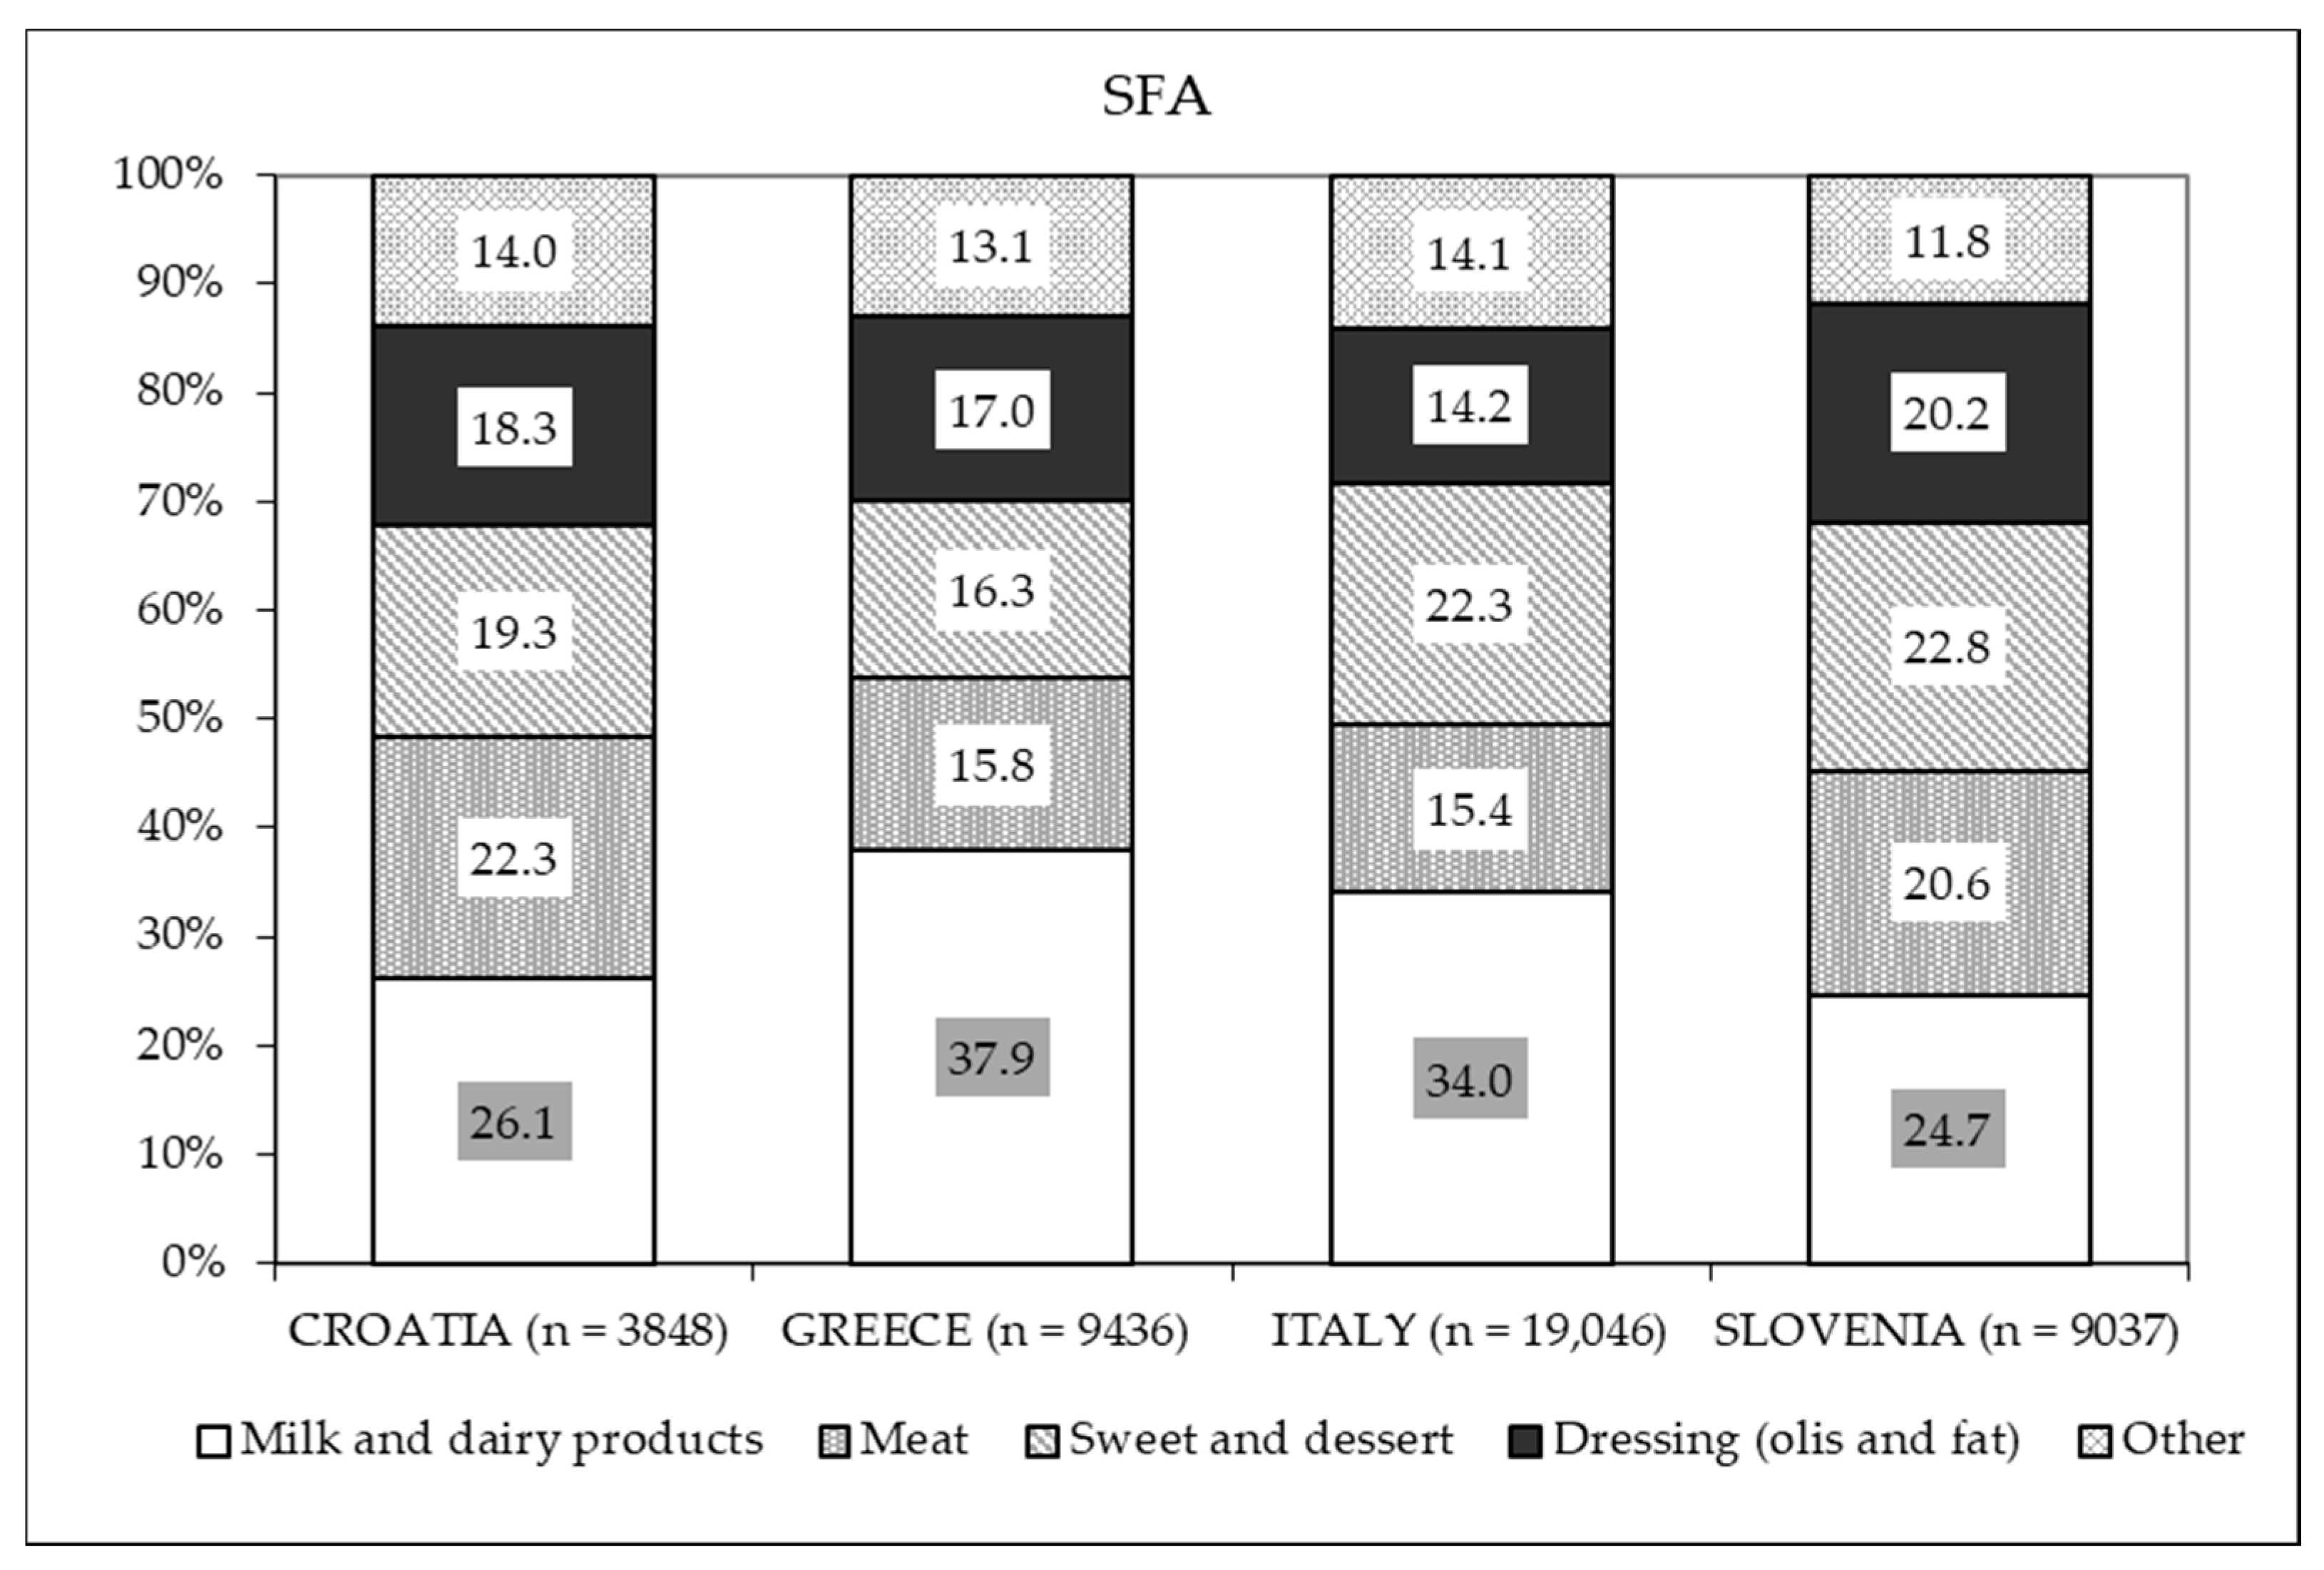
| SFA (g/day) | C | 28.3 | 10.4 | 26.0 | 22.5–38.5 | <0.01 | 10 E% 3 | 30.9 | - | 69.1 |
| G | 30.1 | 13.2 | 27.6 | 21.4–40.7 | 29.6 | - | 70.4 | |||
| I | 29.5 | 10.0 | 27.9 | 24.3–37.4 | 25.7 | - | 74.3 | |||
| S | 26.6 | 9.0 | 25.0 | 21.6–34.0 | 28.5 | - | 71.5 | |||
| EPA + DHA (mg/day) | C | 690.8 | 439.0 | 569.0 | 393.5–828.8 | <0.01 | 350–450 mg/day 2 | 17.7 | 16.9 | 64.4 |
| G | 571.4 | 381.6 | 489.9 | 314.6–742.7 | 29.9 | 15.6 | 54.5 | |||
| I | 404.6 | 264.1 | 337.7 | 231.9–489.4 | 52.8 | 18.4 | 28.8 | |||
| S | 415.6 | 256.2 | 365.9 | 248.8–520.2 | 45.3 | 22.4 | 32.4 |
| Micronutrients | Country | Mean | SD | Median | IQR | p-Value 1 | DRV | % of Women below (<) DRV | % of Women above (≥) DRV |
|---|---|---|---|---|---|---|---|---|---|
| Calcium (mg/day) | C | 1123.9 | 459.9 | 1102.1 | 820.3–1460.1 | 0.10 | 1000 mg/day | 41.2 | 58.8 |
| G | 1132.3 | 496.6 | 1111.0 | 791.0–1450.8 | 43.3 | 56.7 | |||
| I | 1142.5 | 390.9 | 1100.9 | 930.5–1432.0 | 39.3 | 60.7 | |||
| S | 1088.4 | 409.7 | 1026.1 | 842.2–1395.3 | 48.2 | 51.8 | |||
| Iron (mg/day) | C | 15.3 | 4.8 | 14.9 | 12.1–20.0 | <0.01 | 16 mg/day | 58.1 | 41.9 |
| G | 15.2 | 5.1 | 15.1 | 11.6–19.7 | 56.7 | 43.3 | |||
| I | 14.4 | 4.6 | 13.8 | 11.7–18.2 | 67.5 | 32.5 | |||
| S | 15.2 | 4.9 | 14.7 | 12.4–19.2 | 60.3 | 39.7 | |||
| Phosphorus (mg/day) | C | 1601.3 | 520.6 | 1550.9 | 1248.6–2048.7 | 0.05 | 550 mg/day | 0 | 100.0 |
| G | 1496.8 | 507.5 | 1469.3 | 1165.2–1873.2 | 1.0 | 99.0 | |||
| I | 1534.1 | 440.3 | 1513.2 | 1281.6–1932.4 | 0.2 | 99.8 | |||
| S | 1479.2 | 464.7 | 1417.1 | 1172.0–1877.8 | 0.6 | 99.4 | |||
| Potassium (mg/day) | C | 4855.1 | 1629.4 | 4793.6 | 3910.3–6378.5 | <0.01 | 3500 mg/day | 22.8 | 77.2 |
| G | 4730.9 | 1605.6 | 4767.0 | 3524.4–6138.7 | 26.4 | 73.6 | |||
| I | 4204.3 | 1454.8 | 4047.2 | 3397.8–5330.1 | 35.5 | 64.6 | |||
| S | 4577.0 | 1448.4 | 4356.2 | 3677.2–5811.3 | 24.1 | 75.9 | |||
| Sodium (mg/day) | C | 2010.8 | 682.1 | 1959.0 | 1582.7–2509.2 | <0.01 | 1500 mg/day | 25.0 | 75.0 |
| G | 2103.1 | 899.3 | 2009.3 | 1537.0–2667.0 | 26.1 | 73.9 | |||
| I | 1880.3 | 646.7 | 1793.8 | 1466.4–2383.0 | 32.4 | 67.7 | |||
| S | 1704.0 | 660.2 | 1571.2 | 1277.9–2144.8 | 44.4 | 55.6 | |||
| Zinc (mg/day) | C | 12.0 | 3.8 | 11.5 | 9.6–15.5 | <0.01 | 11 mg/day | 41.2 | 58.8 |
| G | 11.2 | 3.5 | 11.3 | 8.8–14.2 | 45.2 | 54.8 | |||
| I | 11.5 | 3.3 | 11.3 | 9.7–14.7 | 47.4 | 52.6 | |||
| S | 10.7 | 3.2 | 10.3 | 8.8–16.7 | 56.5 | 43.5 | |||
| Vitamin B1 (mg/day) | C | 1.34 | 0.42 | 1.30 | 1.1–1.6 | 0.10 | 1.4 mg/day | 56.6 | 43.4 |
| G | 1.27 | 0.40 | 1.28 | 1.0–1.6 | 60.5 | 39.5 | |||
| I | 1.25 | 0.39 | 1.21 | 1.0–1.5 | 67.7 | 32.4 | |||
| S | 1.28 | 0.38 | 1.26 | 1.0–1.5 | 65.3 | 34.7 | |||
| Vitamin B12 (μg/day) | C | 8.9 | 6.1 | 7.0 | 5.4–10.7 | <0.01 | 4.5 μg/day | 13.2 | 86.8 |
| G | 8.1 | 4.9 | 6.9 | 4.8–10.3 | 23.3 | 76.8 | |||
| I | 6.1 | 3.5 | 5.3 | 4.2–7.5 | 35.8 | 64.2 | |||
| S | 5.9 | 4.3 | 5.1 | 3.6–7.3 | 42.7 | 57.4 | |||
| Folate (µg/day) | C | 465.5 | 171.3 | 444.1 | 363.1–578.3 | <0.01 | 600 µg/day | 77.9 | 22.1 |
| G | 468.8 | 181.0 | 460.2 | 343.8–632.1 | 76.4 | 23.6 | |||
| I | 423.4 | 161.5 | 406.3 | 323.0–542.8 | 86.2 | 13.8 | |||
| S | 441.1 | 166.0 | 414.8 | 341.8–551.7 | 85.0 | 15.0 | |||
| Vitamin B2 (mg/day) | C | 2.24 | 0.81 | 2.18 | 1.6–2.8 | <0.01 | 1.9 mg/day | 33.1 | 66.9 |
| G | 2.00 | 0.73 | 1.97 | 1.5–2.5 | 44.9 | 55.1 | |||
| I | 1.97 | 0.63 | 1.88 | 1.5–2.4 | 51.4 | 48.6 | |||
| S | 2.14 | 0.73 | 2.03 | 1.6–2.6 | 44.4 | 55.6 | |||
| Vitamin B3 (mg/day) | C | 22.5 | 7.1 | 21.6 | 17.7–28.5 | <0.01 | 22 mg/day | 52.2 | 47.8 |
| G | 20.1 | 6.2 | 20.4 | 16.1–25.2 | 59.9 | 40.1 | |||
| I | 19.0 | 5.9 | 18.3 | 15.2–23.8 | 72.3 | 27.7 | |||
| S | 20.1 | 6.3 | 19.8 | 16.5–25.0 | 64.7 | 35.3 | |||
| Vitamin B6 (mg/day) | C | 2.90 | 0.94 | 2.79 | 2.2–3.5 | <0.01 | 1.8 mg/day | 11.8 | 88.2 |
| G | 2.76 | 0.89 | 2.78 | 2.0–3.4 | 17.2 | 82.8 | |||
| I | 2.45 | 0.79 | 2.36 | 1.9–2.9 | 22.0 | 78.0 | |||
| S | 2.74 | 0.86 | 2.67 | 2.1–3.2 | 13.8 | 86.2 | |||
| Vitamin C (mg/day) | C | 281.0 | 146.1 | 254.5 | 187.6–362.4 | <0.01 | 105 mg/day | 5.9 | 94.1 |
| G | 308.7 | 157.2 | 299.1 | 187.9–419.8 | 7.3 | 92.7 | |||
| I | 249.7 | 131.6 | 220.2 | 161.6–319.6 | 8.2 | 91.8 | |||
| S | 270.2 | 140.1 | 237.1 | 175.0–345.2 | 3.8 | 96.2 | |||
| Vitamin D (µg/day) | C | 3.3 | 1.6 | 2.9 | 2.1–4.2 | <0.01 | 15 µg/day | 100.0 | 0 |
| G | 3.1 | 1.6 | 2.7 | 2.0–4.1 | 100.0 | 0 | |||
| I | 3.1 | 1.4 | 2.8 | 2.1–3.8 | 100.0 | 0 | |||
| S | 2.6 | 1.3 | 2.4 | 1.8–3.1 | 100.0 | 0 | |||
| Vitamin E (mg/day) | C | 13.9 | 5.4 | 13.5 | 9.8–16.8 | <0.01 | 11 mg/day | 32.4 | 67.7 |
| G | 15.0 | 5.4 | 14.8 | 10.7–19.2 | 27.4 | 72.6 | |||
| I | 13.5 | 4.9 | 12.9 | 10.0–16.2 | 33.0 | 67.0 | |||
| S | 13.5 | 4.9 | 12.8 | 10.0–16.1 | 32.9 | 67.1 |
Publisher’s Note: MDPI stays neutral with regard to jurisdictional claims in published maps and institutional affiliations. |
© 2021 by the authors. Licensee MDPI, Basel, Switzerland. This article is an open access article distributed under the terms and conditions of the Creative Commons Attribution (CC BY) license (https://creativecommons.org/licenses/by/4.0/).
Share and Cite
Concina, F.; Pani, P.; Carletti, C.; Rosolen, V.; Knowles, A.; Parpinel, M.; Ronfani, L.; Mariuz, M.; Vecchi Brumatti, L.; Valent, F.; et al. Nutrient Intake during Pregnancy and Adherence to Dietary Recommendations: The Mediterranean PHIME Cohort. Nutrients 2021, 13, 1434. https://doi.org/10.3390/nu13051434
Concina F, Pani P, Carletti C, Rosolen V, Knowles A, Parpinel M, Ronfani L, Mariuz M, Vecchi Brumatti L, Valent F, et al. Nutrient Intake during Pregnancy and Adherence to Dietary Recommendations: The Mediterranean PHIME Cohort. Nutrients. 2021; 13(5):1434. https://doi.org/10.3390/nu13051434
Chicago/Turabian StyleConcina, Federica, Paola Pani, Claudia Carletti, Valentina Rosolen, Alessandra Knowles, Maria Parpinel, Luca Ronfani, Marika Mariuz, Liza Vecchi Brumatti, Francesca Valent, and et al. 2021. "Nutrient Intake during Pregnancy and Adherence to Dietary Recommendations: The Mediterranean PHIME Cohort" Nutrients 13, no. 5: 1434. https://doi.org/10.3390/nu13051434