Article

Physiological and Proteomic Analyses Reveal Adaptive Mechanisms of Ryegrass (Annual vs. Perennial) Seedlings to Salt Stress

1
Key Laboratory of Saline-alkali Vegetation Ecology Restoration, Ministry of Education, College of Landscape Architecture, Northeast Forestry University, Harbin 150040, China
2
Key Laboratory of Vegetation Ecology of Ministry of Education, Institute of Grassland Science, Northeast Normal University, Changchun 130024, China
3
School of Applied Meteorology, Nanjing University of Information Science and Technology, Nanjing 210044, China
*
Authors to whom correspondence should be addressed.
Agronomy 2019, 9(12), 843; https://doi.org/10.3390/agronomy9120843
Submission received: 25 November 2019 / Revised: 30 November 2019 / Accepted: 1 December 2019 / Published: 3 December 2019
(This article belongs to the Section Grassland and Pasture Science)

Abstract

:
Ryegrass has a relatively high salt tolerance and is considered to be a promising species for both foraging and turf purposes in salt-affected soils in China. While annual ryegrass and perennial ryegrass are two different species, they have similar genomes. However, little is known about their physiological and molecular response mechanisms to salinity stress. Here, biomass, chlorophyll fluorescence, and inorganic ion and organic solute content were measured. 2-DE-based proteomic technology was then used to identify the differentially expressed proteins in the salt-treated seedlings. The results showed that salt stress reduced growth and photosynthesis in the seedlings of both species, but much more so in annual ryegrass. With increasing salinity, the Na+ concentration increased while the K+ concentration decreased in both species, and the sugars and proline increased as the primary organic solutes used to cope with osmotic stress. Additionally, proteomic analysis revealed 33 and 37 differentially expressed proteins in annual and perennial ryegrass, respectively. Most of the identified proteins were involved in carbohydrate and energy metabolism, photosynthesis, genetic information processes, amino acid metabolism, stress defense, and protein synthesis and folding. The results suggest that the two-ryegrass species had different physiological and proteomic responses. These findings can provide new insights into physiological mechanisms by which ryegrass species respond to salt stress.

1. Introduction

Annual ryegrass (Lolium multiflorum Lam.) and perennial ryegrass (Lolium perenne L.) are widely distributed in Europe, North Africa, and temperate Asia [1]. These two species have very similar genomes but have great differences in morphological characteristics and uses. For example, annual ryegrass can be grown together with other grass species to improve pasture quality [2,3]. Perennial ryegrass is also valued for high yield potential as forage grass, but this species can also be used for a variety of turf applications (e.g., home lawns, fairways, athletic fields, and golf courses) [4,5]. In addition, both ryegrasses have good salt tolerance and are considered promising in the bioremediation of salt-affected soil in northeastern China.
Salt stress is one of the most serious environmental factors that can inhibit plant growth and productivity by disrupting physiological processes [6]. It has been reported that as much as 831.4 million hectares of land area, or approximately 19.5% of agricultural land, is salt-affected [7]. In China, approximately 7 million hectares (ha) of land is affected by high salinity. Soil salinity primarily induces osmotic stress, ion imbalance, and nutrient deficiency, which result in plant wilting and sometimes death [8]. To minimize the detrimental effects from salt stress, plants employ numerous adaptive physiological strategies at both the molecular and cellular levels to resist the harsh environment [9]. For example, plants can accumulate substances that act as osmotic regulators, such as soluble sugars, proline, and glycine betaine, in response to salt stress [10]. In addition, the expression profiles of numerous genes and proteins can be altered to help plants survive in saline environments [11]. However, the molecular mechanisms of plant responses to salt stress are complex and vary among different species. To date, there has been no report on ryegrass (annual or perennial) response mechanisms to high salinity stress.
Few studies have examined the effect of salt stress on the physiological responses of ryegrass seedlings, and the majority of those have focused on perennial ryegrass. Their results have indicated that the salt tolerance mechanisms of annual and perennial ryegrass are mainly associated with changes in ion transport (Na+, K+, Ca2+, and Cl), antioxidant enzyme activities (SOD, POD, and APX), osmoregulatory substances (proline), gene expression (LpP5CR, Chl Cu/ZnSOD, Cyt Cu/ZnSOD, and FeSOD) and nutrient absorption (P) [12,13,14,15]. However, the differences in physiological and molecular mechanisms between the two species under salt stress remain poorly understood. Exploring the molecular mechanisms and adaptive strategies that confer salinity tolerance to ryegrass may also be meaningfully applied in the breeding of salt-tolerant annual and perennial ryegrass cultivars.
Recently, an increasing number of large-scale omics analytical methods, such as genomics, transcriptomics, proteomics, metabolomics, ionomics, lipidomics, and glycomics, have been used to investigate the molecular mechanisms by which plants resist environmental stresses at the whole-plant scale [16]. However, proteomics research has attracted a relatively large amount of attention compared with other omics methods because it provides a large amount of information on individual proteins, which are involved directly in many physiological processes [17]. The 2D gel-based protein separation methodology, used for protein identification by mass spectrometry (MS), also provides on the opportunity to analyze the global protein expression profile. So far, studies have used proteomics to explore the physiological adaptation mechanisms of plant salt tolerance in both halophytes and glycophytes [18,19,20,21,22,23,24,25]. However, no information is available on the salt-adaptive mechanisms of annual and perennial ryegrass seedlings.
Therefore, in the present study, we hypothesized that although the two ryegrass species are similar in many parts, they also show differences in their physiological adaptation strategies and molecular regulation network under salt stress. To test the hypothesis, the growth, chlorophyll fluorescence, solutes, inorganic ion content, and proteome of ryegrass seedlings were measured, and we aimed to elucidate and compare the salt-responsive physiological and proteomic features in the seedlings of annual and perennial ryegrass.

2. Materials and Methods

2.1. Plant Materials and Stress Treatments

Annual ryegrass (Lolium multiflorum Lam.) and perennial ryegrass (Lolium perenne L.) seeds were obtained from the Grassland Ecosystem Field Station, Northeast Forestry University, Heilongjiang province of China (125°22′ E, 46°27′ N) in 2017. The seeds were placed in a dry seed bag and stored at low temperature for further experimentation (a test was conducted in October 2017). Seeds with similar size and weight were selected and were washed in distilled water three times [26]. Ryegrass seeds were evenly sowed in the pots containing sand and soil (volume 1:3) with four replicates of 25 seeds per pot. After successful transplanting, daily irrigation with 150 mL of 0.5-time improved Hoagland nutrient solution was applied to the seedlings. The nutrient solution containing 5.00 mM Ca2+, 2.00 mM Mg2+, 6.04 mM K+, 22.2 μM EDTA-Fe2+, 6.72 μM Mn2+, 3.16 μM Cu2+, 0.765 μM Zn2+, 2.10 mM SO42+, 1.00 mM H2PO4, 46.3 mM H3BO3, and 0.566 μM H2MoO4 [27].
When the seedlings were grown to 60 d, they were treated with stress treatments, and three salt concentrations of 0 mM (CK), 100 mM NaCl (S1), and 200 mM NaCl (S2) were applied, and the stress treatment was carried out for 7 d. The seedlings of annual ryegrass and perennial ryegrass were then harvested.

2.2. Fresh Weight and Dry Weight of the Seedlings

The harvest seedlings of ryegrass were washed with distilled water three times. The shoots and roots were separated, and the shoots were placed in an oven at 105 °C and then dried at 80 °C to reach a constant weight, and the fresh and dry weights of the seedlings were measured for each plant [28].

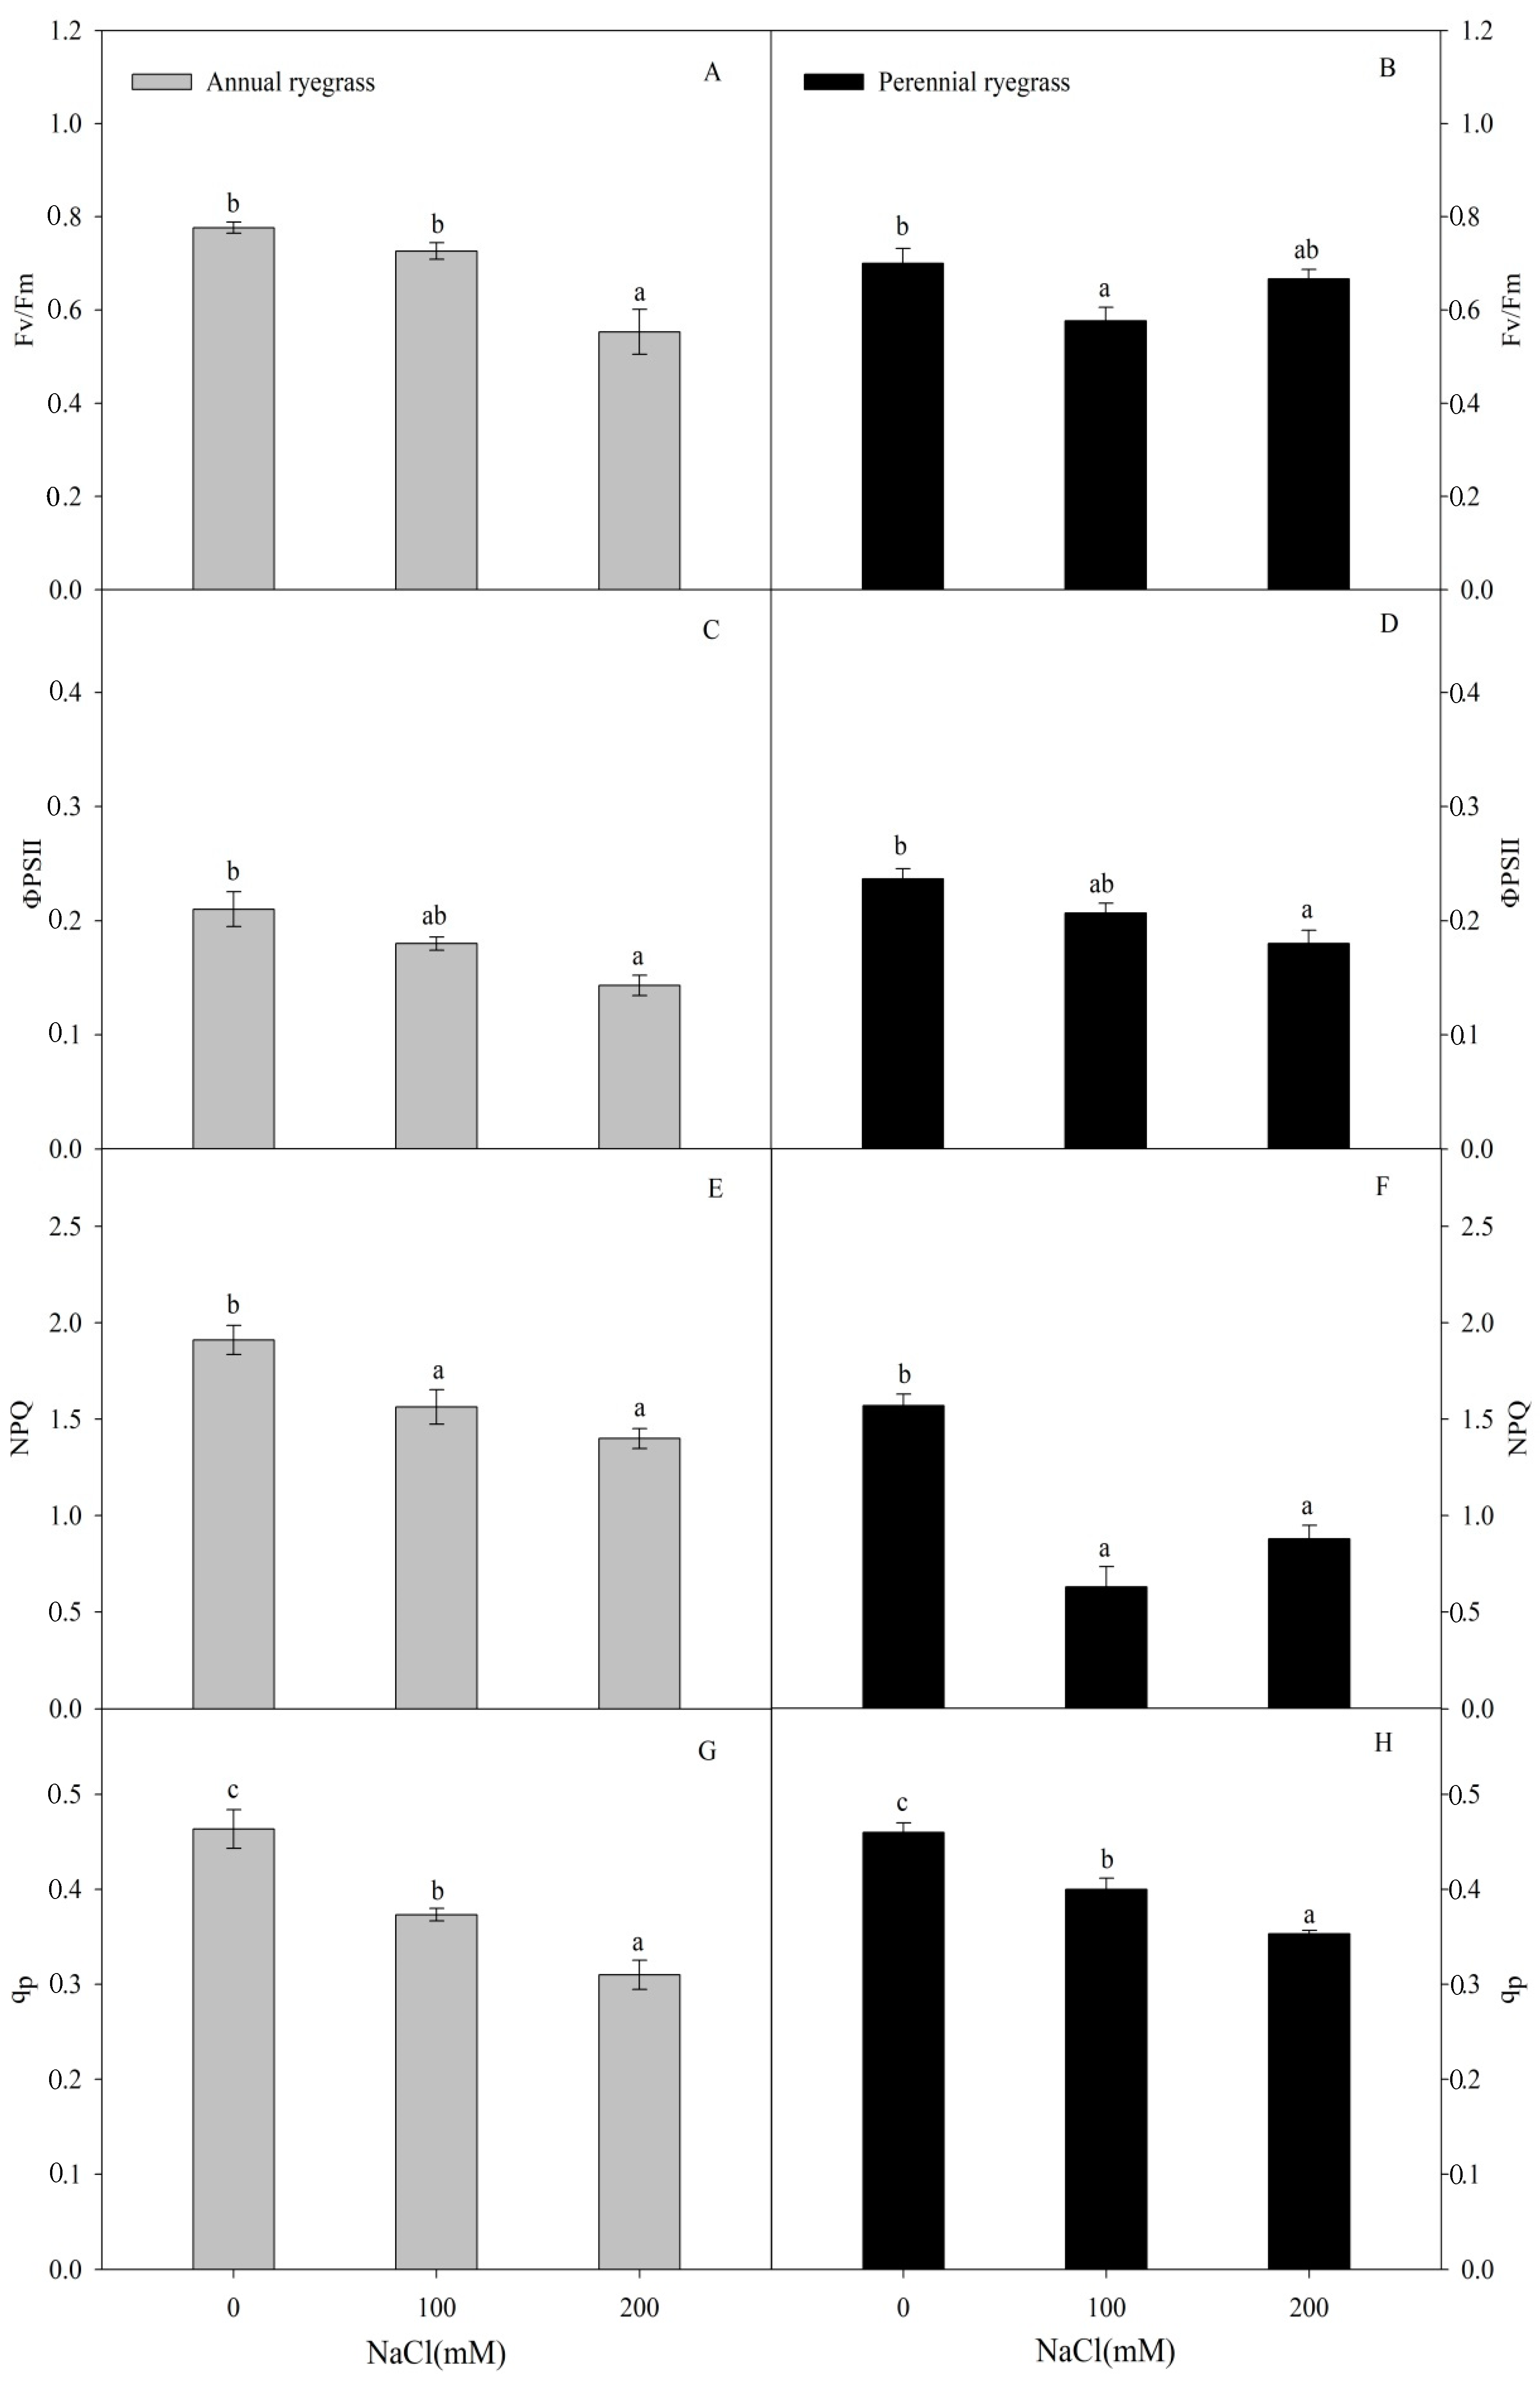
2.3. Chlorophyll Fluorescence

Chlorophyll fluorescence imaging of the seedlings in each treatment was measured with a pulse amplitude modulation chlorophyll fluorescence imaging system (Open FluorCam FC 800-O, Photon System Instruments, Brno, Czech Republic). The minimum fluorescence (F0), maximum fluorescence (Fm), maximum photochemical efficiency (Fv/Fm), photosynthetic electron transport rate (ETR), actual photochemical efficiency of PS II (ΦPSII), photochemical quenching coefficient (qp, and non-photochemical quenching (NPQ) were evaluated. These parameters were calculated as follows:
ΦPSII = (Fm′ − Fs)/Fm′
qp= (Fm′ − Fs)/(Fm′ − F0′)
ETR = ΦPSII × PPFD × 0.5 × 0.84
where PPFD was the actinic light intensity, 0.5 was the proportion of light energy assigned to PS II, and 0.84 meant that 84% of the incident light was absorbed by seedlings [29]. All the treatments have three replicates.

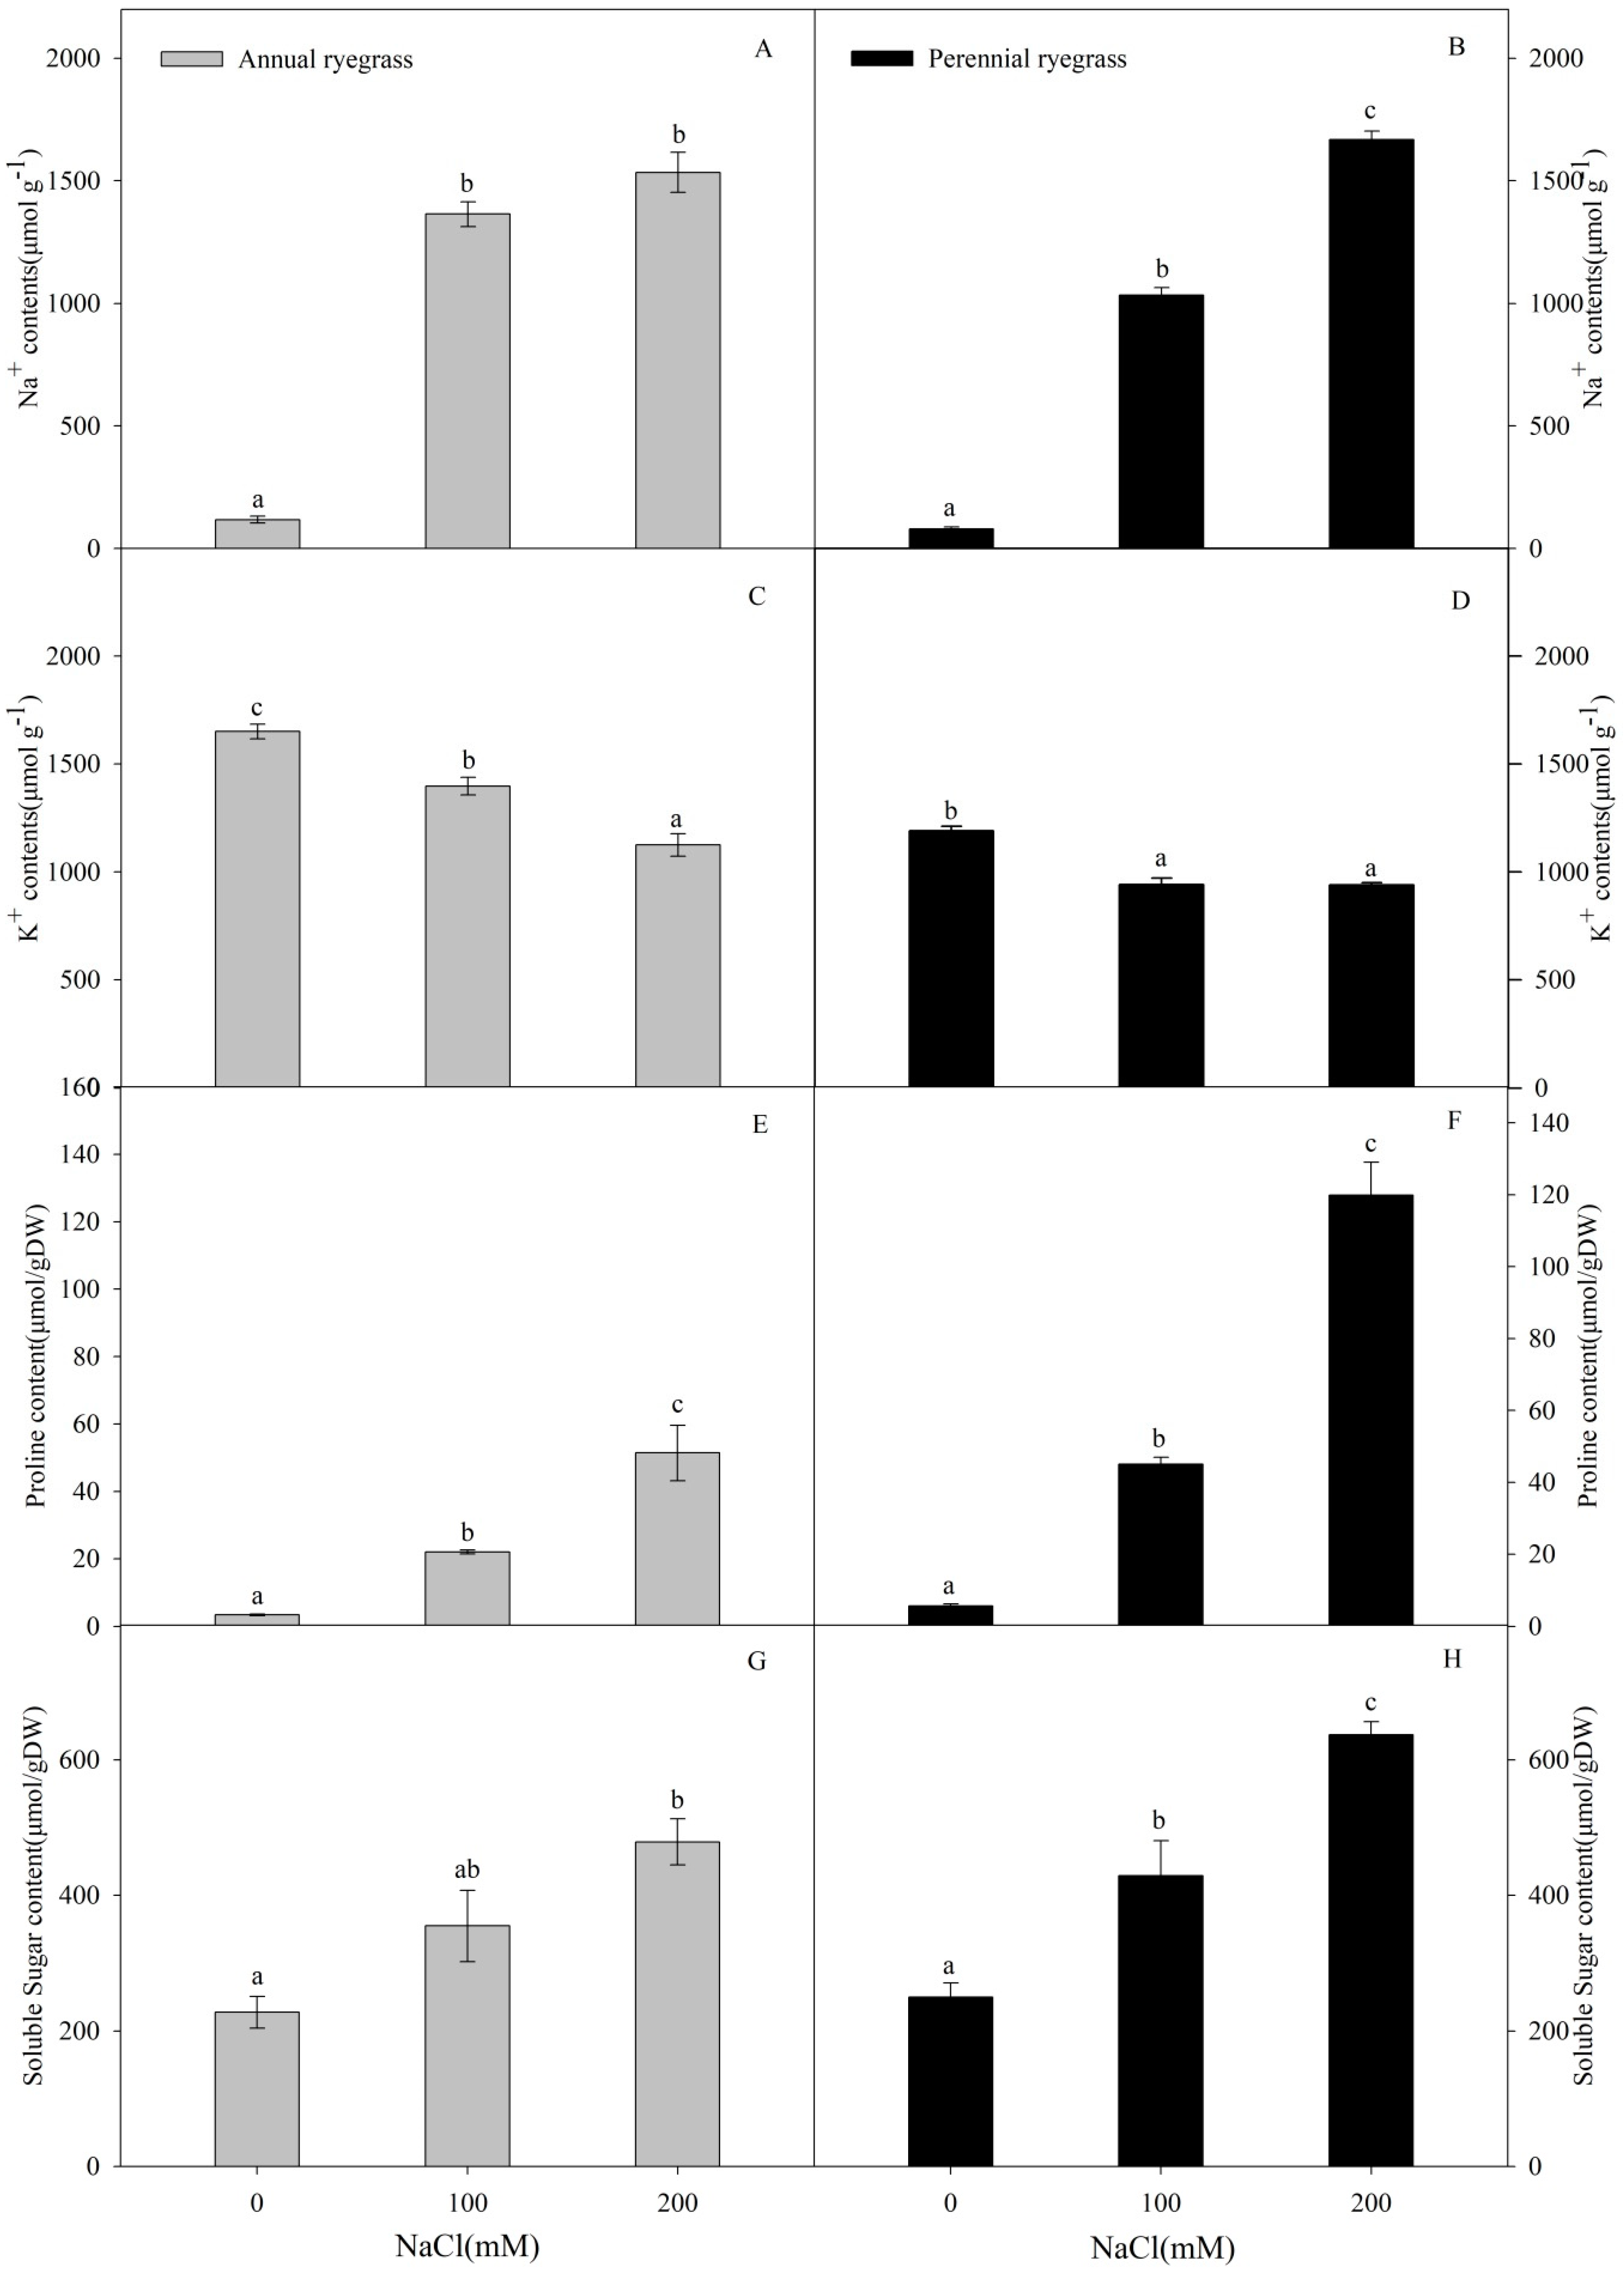
2.4. Inorganic Ion Contents

Dry samples of plant material (25 mg) were treated with 10 mL deionized water at 100 °C for 1 h and the extract was taken to determine the inorganic ions contents. The extract was centrifuged and passed through a microporous membrane. Na+ and K+ contents were determined by an atomic absorption spectrometer (TAS-990, Purkinje General, Beijing, China) in three independent replicates.

2.5. Proline and Total Soluble Sugar Contents

Proline was extracted with 3% sulfosalicylic acid for 1 h, and the absorbance was measured with ninhydrin at 520 nm in three independent replicates per sample [30]. Total soluble sugars were extracted with absolute ethanol and freshly prepared anthrone reagent for 15 min, after which the absorbance was measured at 620 nm also in three independent replicates per sample [31].

2.6. Protein Extraction

The proteins were extracted using the phenol method [23]. Proteins were extracted from aliquots of 1 g FW samples taken from the control and 200 mM NaCl treated ryegrass seedlings. Frozen leaf tissue was ground in liquid nitrogen to a fine powder and incubated in ice-cold extraction buffer (from 0.1 M pH 8.0 Tris-HCL, 0.9 M sucrose, 10 mM EDTA, and 0.4% β-mercaptoethanol) overnight at −20 °C. After centrifugation, the precipitate was washed with ice-cold 80% acetone. Total protein was extracted in a lysis buffer (7 M urea, 2 M thiourea, 4% CHAPS, 40 mM DTT, 4% proteinase inhibitor cocktail, and 2% (v/v) pH 4–7 ampholytes). The subsequent supernatant was collected. Protein concentrations were determined with a 2D-Quant-Kit (GE Healthcare, Princeton, NJ, USA). The precipitate protein was stored at −80 °C for further analysis.

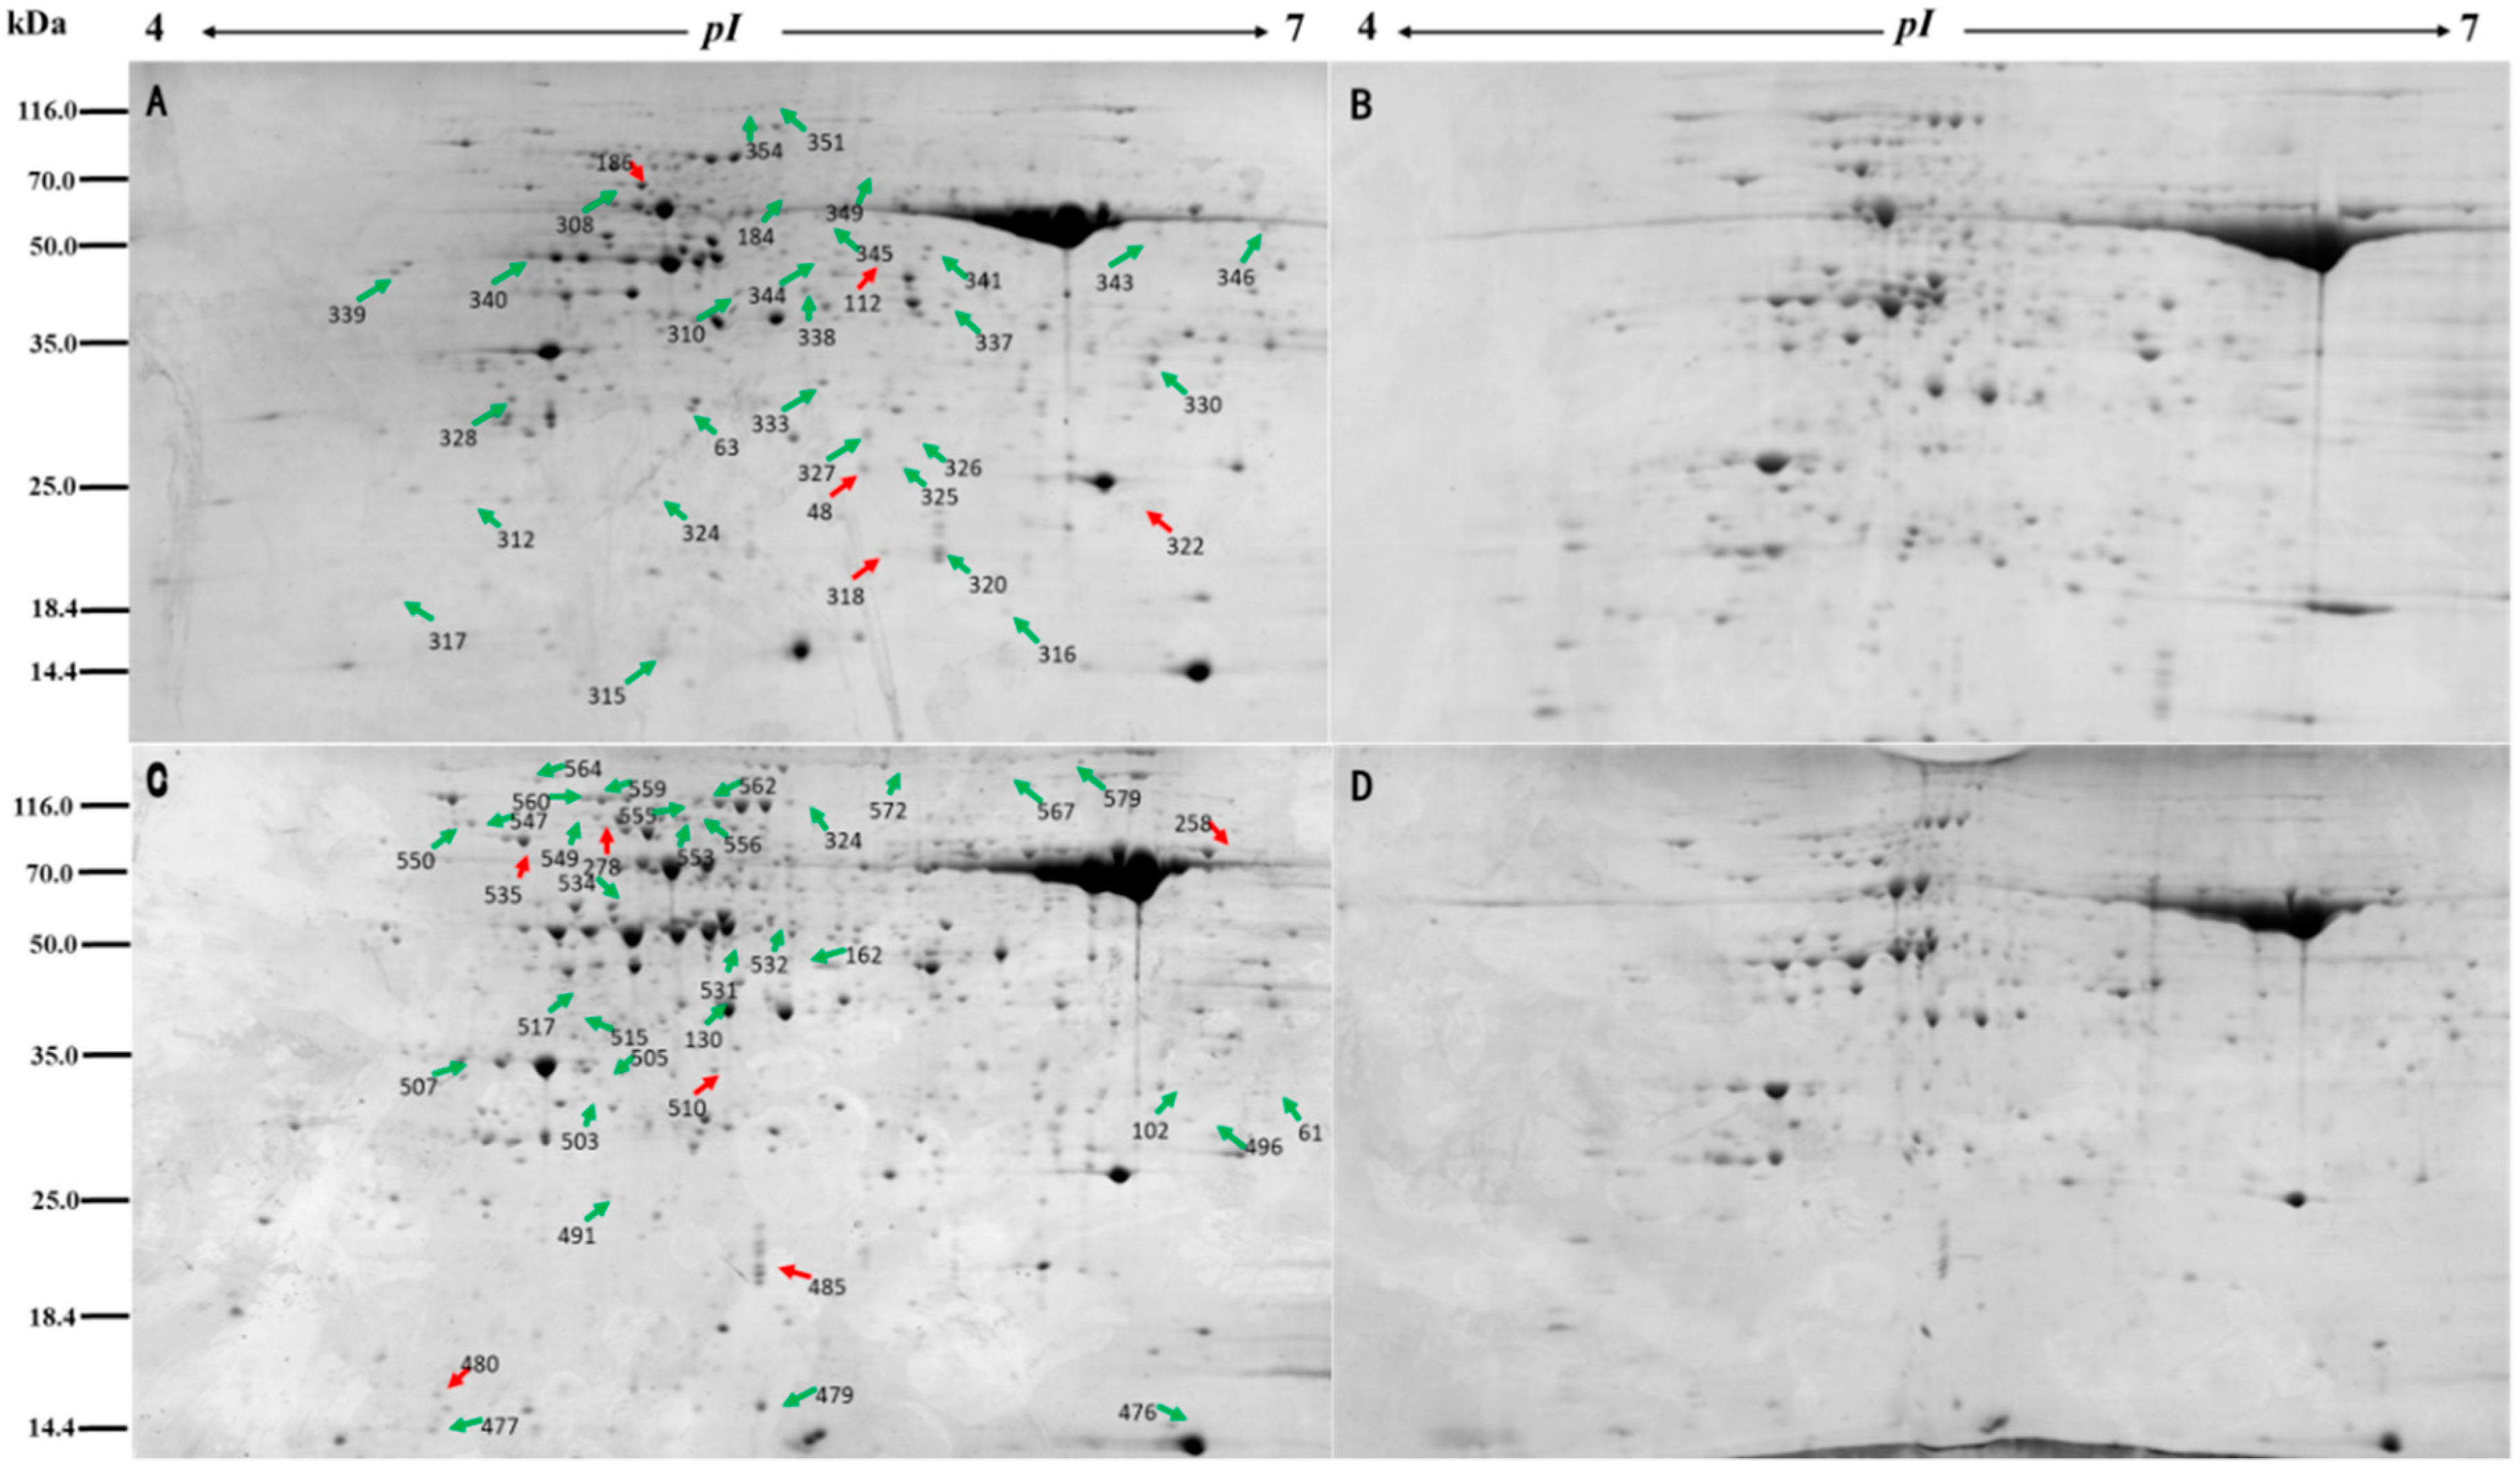
2.7. Two-Dimensional Electrophoresis

A total of 1300 µg of proteins in each sample was loaded on 24 cm IPG strip by rehydration bromophenol blue) loading at room temperature. Rehydration solution contains 7 M urea, 2 M thiourea, 2% (w/v) CHAPS, 20 mM DTT, 0.5% (v/v) pH 4-7 IPG Buffer, and 0.002% (v/v) bromophenol. After rehydration, isoelectric focusing was conducted in the following steps: 30 V for 8 h, 50 V for 4 h, 100 V for 1 h, 300 V for 1 h, 500 V for 1 h, 1000 V for 1 h, and 8000 V for 12 h. After IEF, the strips were incubated in equilibration buffer containing 0.05 M Tris-HCl pH 6.8, 2.5% SDS, 10% (v/v) glycerol, and 2% DTT, and shaken for 15 min, and then for another 15 min with the iodoacetamide replaced DTT equilibration buffer [32]. The second-dimension separation of proteins was performed on SDS-PAGE gel (12.5% polyacrylamide) using an Ettan™ Daltsix apparatus (GE Healthcare, Waukesha, WI, USA).

2.8. Gel Image Scanning and Protein Expression Abundance Analysis

The decolorized SDS-PAGE gel was placed on an Image Scanner III gel sweeper (GE Healthcare Waukesha, WI, USA) to complete the gel image scan. Image analysis was performed with ImageMaster 2D Platinum Software Version 7.0 (GE Healthcare, Waukesha, WI, USA). The molecular weight, relative abundance, and isoelectric point of each protein spot were obtained, and the differentially expressed protein between the control and stress treatment was analyzed for subsequent mass spectrometry analysis.

2.9. In-Gel Digestion and MALDI-TOF/TOF Analysis

Selected spots were excised from 2D gels, washed with sterile deionized water, and digested with trypsin as described previously [33]. Analysis was performed using MALDI TOF/TOF mass spectrometry (Applied Biosystems). By matching the parameters and setting the results, the information about the protein abundance change was obtained, and the peptide and family information were saved and integrated. After mass spectrometry identification, the obtained mass spectrometry results were searched by MASCOT Dameon software in the NCBI protein database. For the proteins identified by MASCOT, their accession numbers were directly searched against the NCBInr database (http://blast.ncbi.nlm.nih.gov/) and UniProt database (http://www.ebi.uniprot.org/) to obtain the proteins corresponding blast information. Non-commercial databases, KEGG (http://www.genome.jp/kegg/pathway.html), were utilized to search for protein functional classification. By matching the parameters and setting the results, the information about the protein abundance change is obtained, and the peptide and family information are saved and integrated.

2.10. Statistical Analysis

The experimental data processing was performed using SPSS software (Version 13.0, SPSS Inc., Chicago, IL, USA). One-way ANOVA was performed to test the differences between control and NaCl-treated seedlings of annual and perennial ryegrass by Tukey post hoc test. The differences were considered significant when p < 0.05.

3. Results

3.1. Physiological Changes of Annual Ryegrass and Perennial Ryegrass under Salinity

With increasing salinity, both the fresh and dry weights of annual ryegrass and perennial ryegrass decreased (Table 1); however, the magnitude of the decreases were different. For example, the dry weight of annual ryegrass at 200 mM salinity decreased by 52.6% compared with the control group. However, the dry weight of perennial ryegrass only decreased by only 38.3% at the same salt concentration.
With increasing salinity, the Fv/Fm, ΦPS II, NPQ, and qp values of annual ryegrass and perennial ryegrass seedlings generally decreased, but the decreases differed based on salinity and ryegrass species (Figure 1). For example, the Fv/Fm in the seedlings of annual ryegrass at the highest salinity (200 mM) decreased by 30% compared with the control group (p < 0.05). However, no significant change was found in the seedlings of perennial ryegrass at the 200 mM salt concentration (Figure 1A,B). In addition, while the responses to changing salinities were similar, the ΦP SII and qp values in the seedlings of perennial ryegrass were higher than those in annual ryegrass under both control and high salinity conditions (Figure 1C,D,G,H).
Logically, the Na+ concentrations in seedlings of annual ryegrass and perennial ryegrass increased with the increasing salinity and were highest in the 200 mM salinity conditions (p < 0.05; Figure 2A,B). However, the K+ concentrations decreased with increasing salinity. The K+ concentrations decreased by 15.3% and 31.8% at the 100 and 200 mM treatments, respectively, for annual ryegrass, while they decreased by 20.8% and 21.1% in the same treatments for perennial ryegrass (Figure 2C,D).
The seedlings of the two-species accumulated large amounts of organic solutes in the high salinity conditions. For example, proline content increased 15.2-fold and 21.3-fold at 200 mM salinity for annual and perennial ryegrass, respectively (p < 0.05; Figure 2E,F). The total soluble sugar content in annual ryegrass increased from 227.6 μmol/g to 478.7 μmol/g and increased from 250.0 μmol/g to 637.2 μmol/g in perennial ryegrass at 200 mM salinity (p < 0.05; Figure 2G,H).

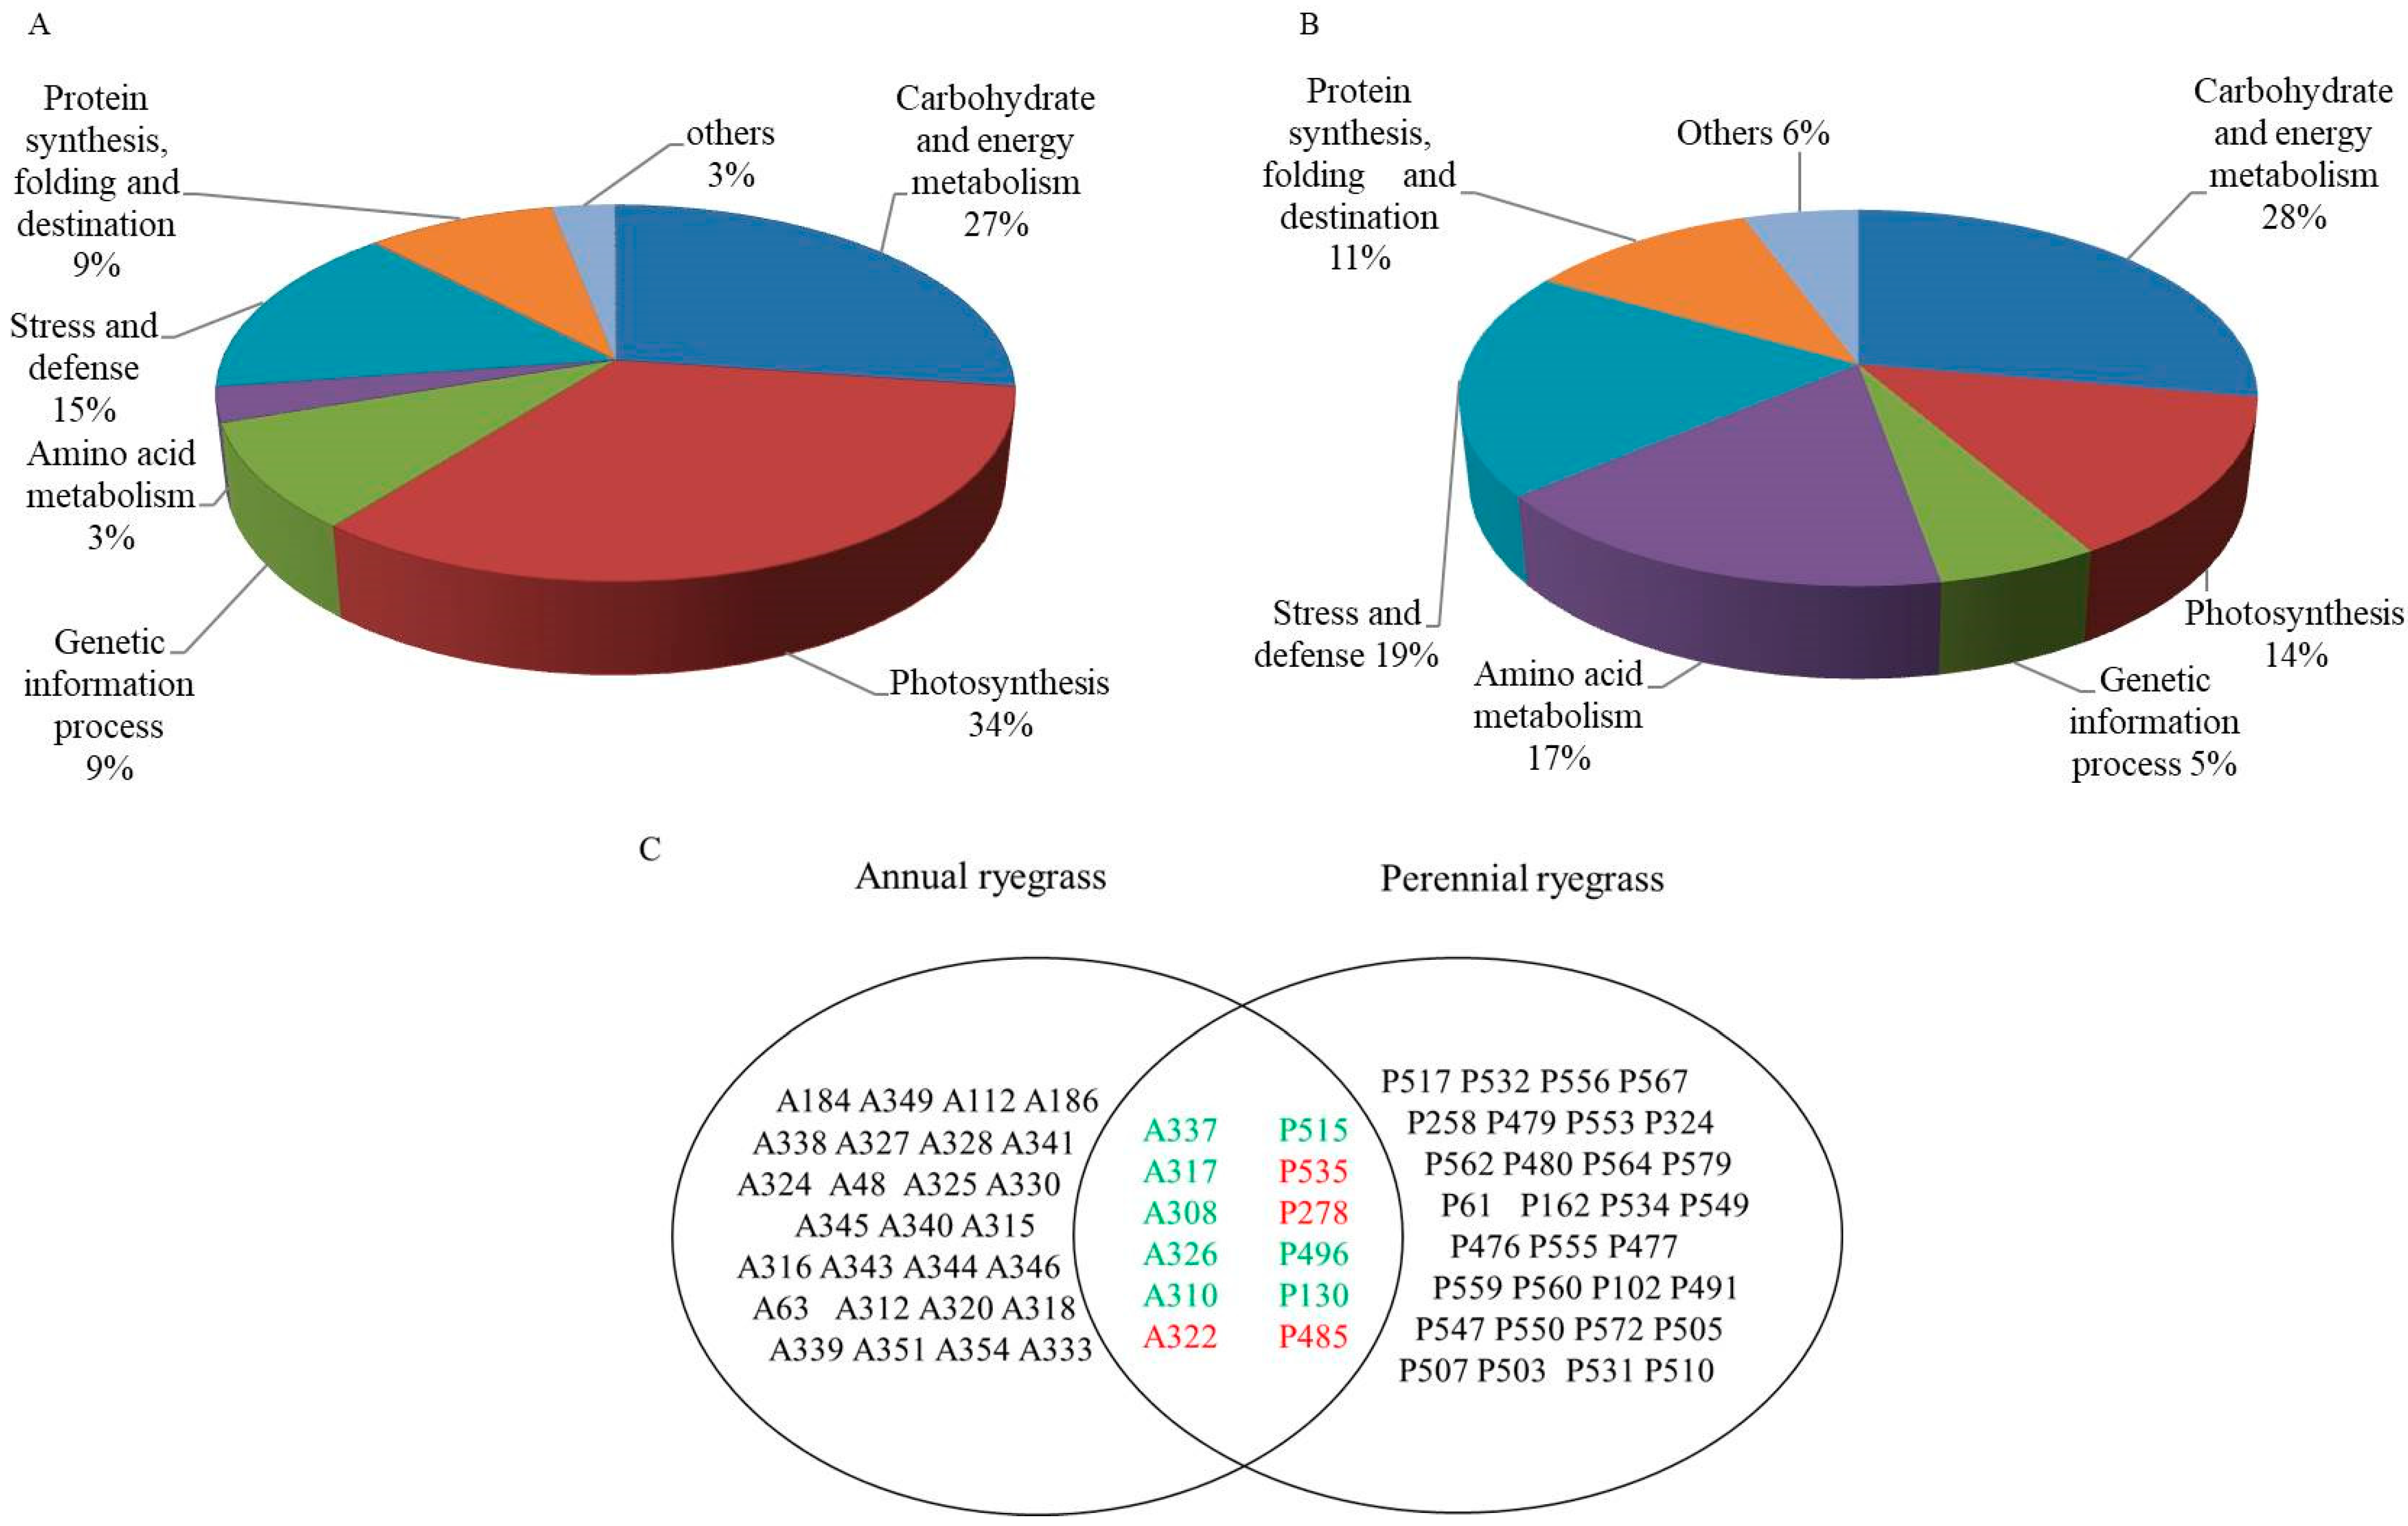
3.2. Proteomic Analysis of Annual Ryegrass and Perennial Ryegrass under Salinity

To investigate the changes of proteome profiles in the seedlings of annual ryegrass and perennial ryegrass under salinity stress, we measured changes in expression of salt-responsive proteins using 2-DE gels. Differences were by comparing between the control (0 mM NaCl) and high salinity (200 mM NaCl) treatments in the seedlings of annual and perennial ryegrass. When a protein spot had an average fold change > 1.5 and a p-value < 0.05, it was considered to be differentially expressed. In this analysis, more than 709 protein spots in annual ryegrass and 854 protein spots in perennial ryegrass seedlings were reproducibly detected on gels using the Melanie 7.0 software. The results showed that 33 protein spots in the seedlings of annual ryegrass were differentially accumulated, while 37 proteins in the seedlings of perennial ryegrass were differentially expressed (Table 2 and Table 3, respectively).
The 70 differentially expressed protein spots were submitted for identification by MALDI-TOF/TOF. The information on the mass spectrometry analysis was showed in Supplementary Material 1. Through peptide matching in the MASCOT database (Figure 3; Figures S1 and S2). Compared with the control group, of the 33 differentially accumulated proteins in annual ryegrass seedlings, 5 proteins were up-regulated and 28 proteins were down-regulated (Table 2). For the 37 differentially accumulated proteins of perennial ryegrass seedlings, 6 proteins were up-regulated under high salinity conditions and 31 proteins were down-regulated (Table 3).
The characters of these proteins were determined based on BLAST analyses using the NCBInr database. The differentially accumulated proteins from the annual ryegrass seedlings were divided into seven functional groups based on their roles in different metabolic pathways. The proteins were grouped into nine categories based upon their biochemical functions, including carbohydrate energy metabolism (9), photosynthesis (11), genetic information processes (3), amino acid metabolism (1), stress defense (5), protein synthesis and folding (3), and others (1) (Figure 4A). The same grouping classifications were used for perennial ryegrass, and the categories included carbohydrate energy metabolism (10), photosynthesis (5), genetic information processes (2), amino acid metabolism (6), stress defense (7), protein synthesis and folding (4), signal transduction (1), and other pathways (2) (Figure 4B). The results showed that there were six proteins shared in common between annual and perennial ryegrass, three of which had opposite accumulation patterns in the two species (Figure 4C), which indicated that annual ryegrass and perennial ryegrass have different mechanisms by which they respond to salt stress.

4. Discussion

4.1. Physiological Response of Annual and Perennial Ryegrass under Salinity Stress

The seedling growth period is one of the most critical periods in the life cycle of plants and can be especially sensitive to stressful conditions [18]. Salinity in the soil can cause low water potential, destroy plant tissues and structures, and strongly affect seedling growth [34]. In the present study, the seedling weights in both species decreased with increasing salinity, but the decrease was greater in the dry weight of annual ryegrass at 200 mM salinity (Table 1), which indicated that salt tolerance of the two ryegrasses were different. Photosynthesis is considered to be one of the clearest indicators that plants are experiencing physiological stress [35]. In addition, the chlorophyll fluorescence parameters are particularly useful as they reflect the photosynthetic characteristics of plants [36]. In our fluorescence experiments the Fv/Fm value did not change much at the highest salinity (200 mM) in perennial ryegrass, but significantly decreased in annual ryegrass (Figure 1A,B), suggesting that the photosynthetic electron transport of annual ryegrass was more inhibited than perennial ryegrass under salt stress. Moreover, compared with annual ryegrass, the perennial ryegrass also had higher ΦPSII and qp values under high salinity conditions.
Plants living in high salinity conditions can accumulate toxic amounts of Na+, while at the same time they are prevented from absorbing K+, which can induce metabolic disorders in plants [37]. In this study, both species accumulated high levels of Na+, while the K+ concentration decreased (Figure 2). Similar results were found in wheat by Li et al. [38] and barley by Yang et al. [39]. Under such conditions, most plants can accumulate proline and soluble sugars in the protoplasm to maintain their osmotic balance. In this study, the annual ryegrass and perennial ryegrass were also able to accumulate osmotic adjustment solutes, including proline and soluble sugars, to compensate for the osmotic imbalance, which may be related to the excess Na+. Notably, the proline and soluble sugar content in perennial ryegrass seedlings were much higher than those in annual ryegrass seedlings. These results indicated that the perennial ryegrass was able to respond more positively to salt stress than annual ryegrass.

4.2. Proteomics Analysis of Annual and Perennial Ryegrass under Salinity Stress

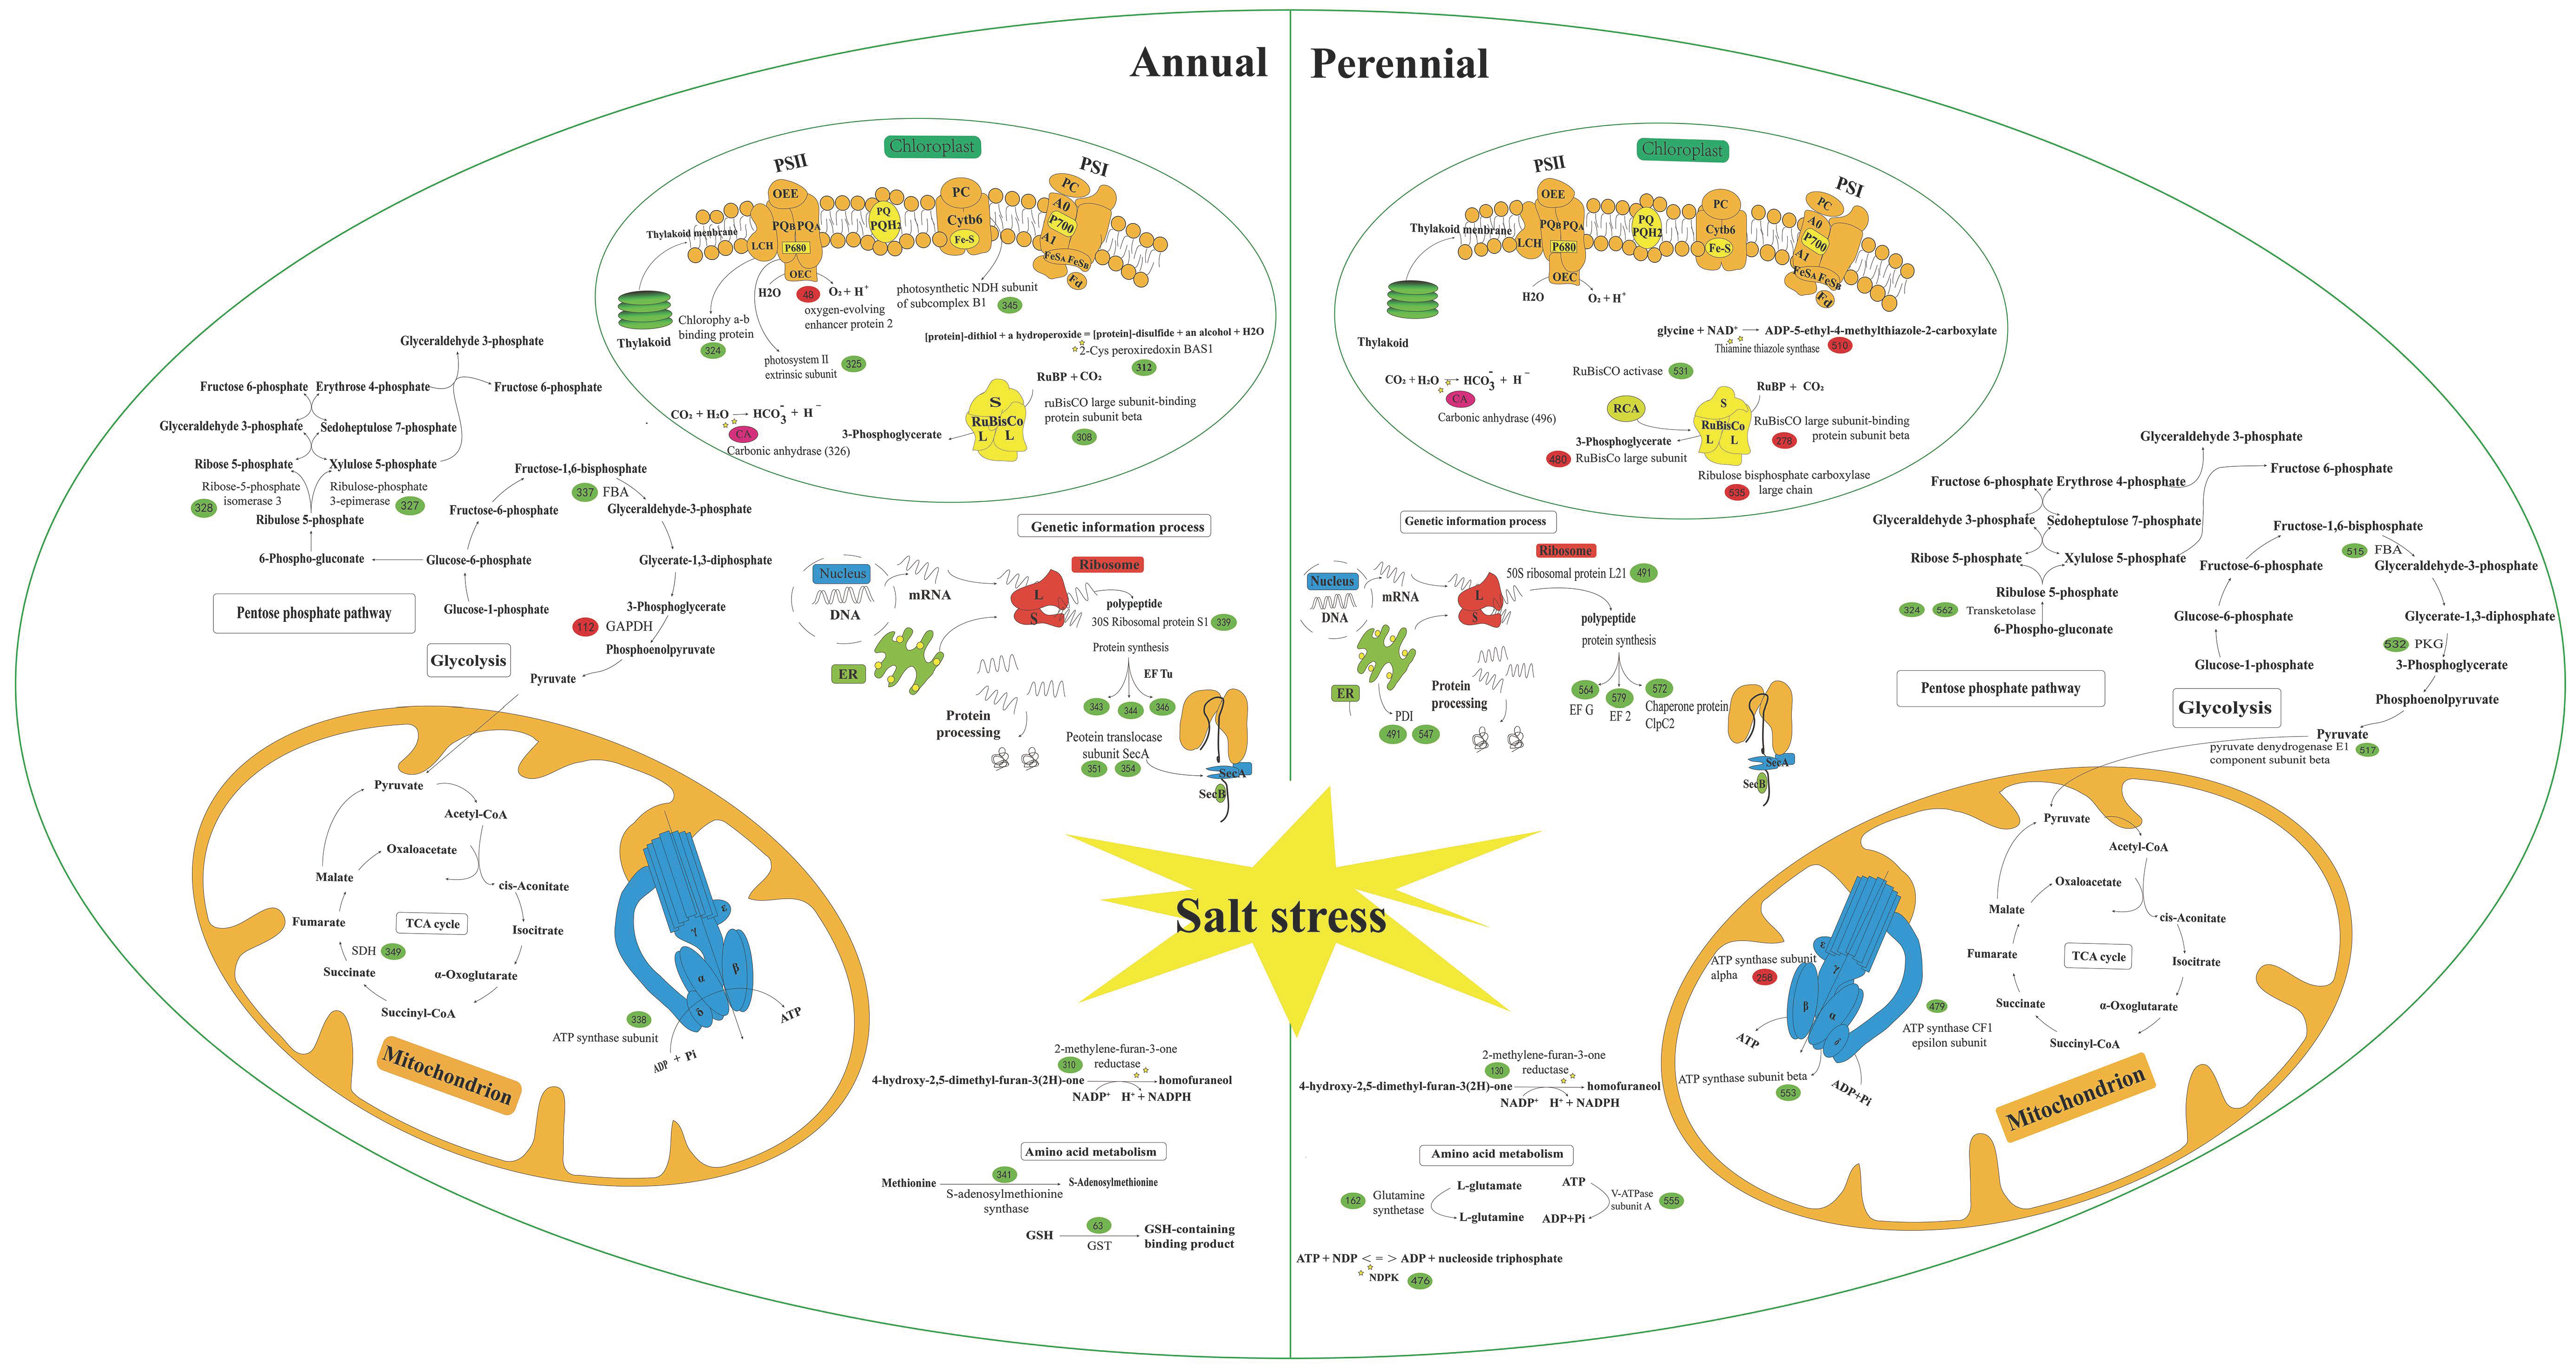
4.2.1. Carbohydrate and Energy Metabolism

In this study three metabolic enzymes, glyceraldehyde-3-phosphate dehydrogenase (GAPDH, spot 112), fructose bisphosphate aldolase (FBA, spot 337), and phosphoglycerate mutase (PGM, spot 186), involved in the glycolysis pathway, were differentially accumulated in annual ryegrass seedlings (Table 2). GAPDH can catalyze the conversion of glyceraldehyde-3-phosphate to 1, 3-diphosphoglycerate, which plays an important role in the plant sugar metabolism pathway [17]. PGM plays a significant role in glycolysis, which catalyzes phosphate from 3-phosphoglyceric acid to a second carbon to form 2-phosphoglyceric acid. The results clearly showed that the abundance of these two proteins (GAPDH and PGM) increased in the annual ryegrass under salt stress, indicating that this grass species was able to provide more intermediate metabolites through glycolysis in response to salinity stress.
For perennial ryegrass, the metabolic enzymes fructose bisphosphate aldolase (FBA, spot 515), pyruvate dehydrogenase (PDH, spot 517), phosphoglycerate kinase (PGK, spot 532), and sucrose synthase (SS, spot 567), involved in glycolysis pathway, were all down-regulated under salt stress (Table 3). FBA can catalyze the conversion of fructose-1, 6-diphosphate to dihydroxyacetone phosphate. In the present study, the isoform of aldolase is cytosolic. PGK mainly catalyzes the formation of glycerophosphates from 1, 3-diphosphoglycerate, key enzymes in the first two stages of the glycolysis pathway. The reduced abundance of these proteins indicated that the glycolysis pathway of perennial ryegrass was inhibited by salinity stress. In addition, PDH catalyzes the oxidative decarboxylation of pyruvate to produce acetyl-CoA, NADH, and CO2. SS can catalyze the reversible reaction of sucrose metabolism and is also a key enzyme that promotes sucrose into various metabolic pathways, such as glycolysis. The reduced abundance of these proteins indicated that perennial ryegrass had insufficient material for glycolysis and was inhibited from utilizing carbohydrates to meet energy demands.
Plants require large amounts of ATP to provide sufficient energy for their growth and development under high salinity conditions [40]. In this study, we found that the accumulations of ATP synthase in annual (spot 338) and perennial ryegrass (spot 479 and 553) were reduced under salinity stress (Table 2 and Table 3). This result indicated that ATP synthesis in both annual and perennial ryegrass was inhibited by salt stress.
The TCA cycle provides essential precursors for amino acid biosynthesis and energy metabolism, and also plays a key role in response to abiotic stressors [41]. Succinate dehydrogenase (SDH), involved in mitochondrial electron transport, is responsible for transferring electrons from succinic acid to coenzyme Q. This enzyme plays a vital role in the TCA cycle pathway and is also capable of integrating multi-subunit enzymes on the inner mitochondrial membrane [42]. It can provide electrons and oxygen to the respiratory chain of cell production, which is a part of carbohydrate metabolism. Here, we found that the abundance of SDH under salt stress in annual ryegrass (spot 349) was reduced (Table 2) but showed no change in perennial ryegrass (Table 3). This result suggested that TCA cycle activity was decreased in annual ryegrass, but unchanged in perennial ryegrass. Similarly, some other studies have reported that decreased TCA cycle activity was related to reduce consumption of organic acids, which might be a strategy to save carbon structures for the synthesis of compounds required to endure stressful conditions [43]. Therefore, the reduction of TCA cycle activity in annual ryegrass might benefit the synthesis of substances used for osmotic regulation in order to cope with salt stress.
Some proteases related to the pentose phosphate pathway are capable of maintaining cellular homeostasis. They can provide amino acids and nucleotide biosynthesis prerequisites for plants, and also reduce molecules against oxidative stress [44]. We found that ribulose-phosphate 3-epimerase (RPE, spot 327), ribose-5-phosphate isomerase 3 (RPI3, spot 328), and S-adenosylmethionine synthetase (SAMS, spot 341) were reduced in abundance in annual ryegrass under salt stress (Table 2). RPE and RPI3 catalyze the reversible epimerization of D-ribulose 5-phosphate to D-xylulose 5-phosphate, which are key members of the pentose phosphate pathway. SAMS can catalyze the reaction of ATP and methionine to form S-adenosylmethionine, which is an important enzyme in both plant metabolism, and responses to stress [45]. The abundance of these proteins was reduced in annual ryegrass, which indicated that salt stress destroyed cell homeostasis of annual ryegrass and caused oxidative damage (Figure 5). In addition, we also found that the abundance of trans ketolase (TK, spot 324 and 562) was reduced in perennial ryegrass (Table 3). TK is a key enzyme in the non-oxidative branch of the pentose phosphate pathway. Its accumulation promotes the ability of non-oxidative branches to produce ribonucleic acids and amino acids via NADPH production [46]. This result indicated that salt stress disrupted the redox balance of perennial ryegrass.

4.2.2. Photosynthesis

One previous study has shown that photosynthesis of plants was greatly inhibited by salt stress as chlorophyll biosynthesis was reduced along with photosystem II efficiency [47]. Our proteomic analysis results showed that three photosynthetic proteins were differentially accumulated in annual ryegrass under salt stress. Chlorophyll a-b binding protein (spot, 324) and photosystem II extrinsic subunit (spot 325) were decreased in annual ryegrass under salt stress (Table 2). Chlorophyll a-b binding protein acts as a light-harvesting complex (LHC) that captures and excites energy transfer to the optical system, which helps PS II convert more light energy and reduce energy loss caused by reductions in PS II efficiency [48]. The photosystem II extrinsic subunit is involved in stabilizing the structure of the photosystem II oxygen-evolving complex (OEC), the ion environment of oxygen evolution, and protects the OEC against heat-induced inactivation. The reductions in protein abundances indicated that the activity of the photosystem II was inhibited in annual ryegrass under salinity stress. In addition, we found that the photosynthesis NDH subunit complex B1 (spot 345), associated with the electron transport chain, was also reduced in annual ryegrass under salt stress (Table 2). The reduced abundance of this protein may mean that photosynthetic electron transport was inhibited in annual ryegrass, potentially due to the salt stress destroying a part of the photosystem in this grass, leading to impaired molecular function in some proteins. However, the expression of these proteins associated with the photosystem II and electron transport chain showed no change in perennial ryegrass (Figure 5). These results are consistent with the Fv/Fm values of the chlorophyll fluorescence parameters in this study, which indicated that the photosynthetic electron transport in annual ryegrass was inhibited more than in perennial ryegrass under salt stress.
Moreover, we found that the accumulation of proteins associated with the Calvin cycle in annual ryegrass all decreased under salt stress, including ribulose bisphosphate carboxylase/oxygenase activase (RuBisCO activase, spot 340), ribulose 1, 5-bisphosphate carboxylase/oxygenase small chain (spot 315 and 316), ribulose 1, 5-bisphosphate carboxylase/oxygenase large chain (spot 317 and 330), RuBisCO large subunit-binding protein subunit beta (spot 308), and carbonic anhydrase (spot 326, Table 2). RuBisCO activase is a molecular chaperone that controls the switching of Rubisco from the inactive to active conformation and is also a key enzyme that affects photosynthetic rate [49]. Carbonic anhydrase (CA) plays an important role in carbon dioxide absorption and carbon fixation. It does this by improving the activity of carbon-fixing related enzymes and increasing the concentration of inorganic carbon ions near carboxylase, thereby enhancing the carbon fixation rate [50]. Hence, the reduced abundance of these proteins indicated that the Calvin cycle in annual ryegrass was significantly inhibited under salt stress. However, we found that the abundances of the RuBisCO large subunit-binding protein subunit beta (spot 278), ribulose-1, 5-bisphosphate carboxylase/oxygenase large subunit (spot 480), and ribulose bisphosphate carboxylase large chain (spot 535) were significantly increased abundance in perennial ryegrass under salt stress (Table 3). RuBisCO large subunit-binding protein subunit beta is able to bind and participate in the assembly process of RuBisCO and maintain carbon fixation in plants. The increased abundance of these proteins in perennial ryegrass indicated that the perennial ryegrass may promote the formation of RuBisCO to maintain its carbon fixation rate in response to salt stress (Figure 5).
Thus, the photosynthetic capacities of annual and perennial ryegrass were both decreased under salt stress. However, perennial ryegrass was able to maintain relatively high photosynthesis capabilities compared to annual ryegrass by enhancing the rate of photosynthetic electron transport and Calvin cycle activity, which can provide more photo-assimilates, helping to cope with salt stress (Figure 1). These results showed that the adaptive strategies regarding photosynthesis were different in annual and perennial ryegrass under salt stress.

4.2.3. Genetic Information Processes and Protein-Destiny

Elongation factor catalyzes amino acids on the ribosome, allowing them to extend and participate in the regulation of protein synthesis. In this study, we found that the abundance of elongation factor Tu (spot 343 and 344, Table 2) in annual ryegrass, and the elongation factor G (spot 564, Table 3) and elongation factor 2 (spot 579, Table 3) in perennial ryegrass were all reduced under salt stress, indicating that salt stress inhibited the protein synthesis of both annual and perennial ryegrass.
Protein folding in annual and perennial ryegrass was also affected by salt stress. The abundance of the protein translocase subunit SecA (spot 351, 354), associated with protein synthesis, was decreased in annual ryegrass under salt stress (Table 2). While the abundances of protein disulfide isomerase (PDI, spot 547, 550) and chaperone ClpC2 (spot 572), associated with protein fate, were decreased in perennial ryegrass (Table 3). The protein translocase subunit SecA is associated with membrane transport devices and is free in the cytosol for use in protein localization and transport [51]. The decreased abundance of this protein may affect protein synthesis in annual ryegrass. Protein disulfide isomerase can catalyze the rearrangement of disulfide bonds in proteins, prevent aggregation of denatured proteins, and participate in metabolic processes [52]. The chaperone protein ClpC2 plays an important role in protein metabolism and is mainly involved in protein modification and chemical reaction pathways. In addition, 30S ribosomal protein S1 (spot 339, Table 2) in annual ryegrass and 50S ribosomal protein (spot 491, Table 3) in perennial ryegrass were both decreased under salt stress. This is similar to previous reports that have shown that ribosomal proteins were down-regulated under osmotic stress and heat stress [53,54]. In general, the abundances of these proteins were decreased under salt stress, affecting protein folding and synthesis in annual and perennial ryegrass.
In addition, we found that 14-3-3-like protein GF14-F (spot 507), which is associated with signal transduction, was decreased in perennial ryegrass under salt stress. Previous studies have shown that 14-3-3 protein played a key role in plants responding to salt stress. It participated in the stress-activated ABA signaling pathways which activate expression of some important genes that enhance stress tolerances of plants [55]. The reduced abundance of this protein in perennial ryegrass indicated that salt stress affected the signal transduction of this species. In summary, the genetic information processes related to protein fate in perennial ryegrass was significantly inhibited (Figure 5).

4.2.4. Amino Acid Metabolism and Stress Defense

Amino acid biosynthesis and metabolism is of critical importance for plant growth, development, and response to stress condition [56,57]. Our results reflected that the proteins associated with cellular processes (including amino acid metabolism and cellular structure) were differentially accumulated in annual ryegrass and perennial ryegrass under salt stress. Glutathione-S-transferase (GST) is a key enzyme in the glutathione binding reaction, which catalyzes the conjugation of reduced glutathione to a wide range of substrates. Glutathione plays an important role in response to environmental stress in plants, such as oxidative stress caused by the generation of reactive oxygen species (ROS) [58]. In this study, the abundance of glutathione-S-transferase (GST, spot 63) was reduced in annual ryegrass under salt stress (Table 2), indicating that the ROS have scavenging ability, i.e., the oxidative stress response of annual ryegrass was inhibited by salt stress.
For perennial ryegrass, proteins associated with amino acid metabolism including GTP-binding nuclear protein (spot 61), tubulin alpha-4 chain (spot 534), glutamine synthetase (spot 162), serine/threonine protein phosphatase (spot 549), and nucleoside diphosphate kinase (spot 476) were all reduced in abundance under salt stress (Table 3). The tubulin alpha-4 chain is a protein associated with the cytoskeleton that can be involved in the division and elongation of plant cells [59]. The abundance of this protein in perennial ryegrass decreased, indicating that salt stress could damage the cytoskeleton and potentially lead to the inhibition of plant growth. GTP-binding proteins are involved in a variety of life processes in cells, such as cell communication, ribosome binding, and protein synthesis [60]. The reduced abundance of this protein, therefore, may have inhibited the amino acid metabolism of perennial ryegrass under salt stress. However, these proteins were not differentially accumulated in annual ryegrass. Overall, the proteomic data pertaining to amino acid metabolism revealed that protein synthesis and protein processing were only inhibited in perennial ryegrass under salt stress.
Moreover, the abundances of several proteins associated with stress defense were also differentially accumulated in annual and perennial ryegrass. The abundance of 2-methylene-furan-3-one reductase (spot 310, Table 2; 130, Table 3), associated with oxidoreductase activity, was reduced in both annual and perennial ryegrass. This protein can utilize NADH and NADPH as electron donors to catalyze redox reactions (Figure 5). We also found that abundance of 2-Cys peroxide reductase BAS1 (spot 312) in annual ryegrass was decreased (Table 2). 2-Cys peroxide reductase BAS1 is a nuclear-encoded chloroplast protein, which plays an important role in the detoxification of peroxides [61]. Therefore, this result indicated that the ability of stress defense in annual ryegrass was weakened by salt stress. Thiamine thiazole synthase (spot 510) catalyzes the transfer of conserved cysteine residues of proteins to thiazole intermediates, which are involved in the biosynthesis of the thiamine precursor thiazole (Table 3). The expression of this protein was decreased in perennial ryegrass under salt stress, indicating that salinity stress affected the stress defense ability in perennial ryegrass. In addition, the abundance of annexin (spot 102) was decreased in perennial ryegrass, indicating that salt stress affected the cell secretory process of this species (Table 3). However, this protein was not differentially accumulated in annual ryegrass. The abundance of germin-like proteins 8-14 (GLPs, spot 320) was also affected by salt stress as it decreased in annual ryegrass (Table 2). A number of GLPs have been reported to be associated with abiotic stresses, as they were able to remove excess ROS and enhance cell wall structures to alleviate oxidative damage [62]. These results indicated that salt stress enhanced cellular response to oxidative damage in annual ryegrass seedlings.
For perennial ryegrass, we found that the abundance of RNA polymerase II transcriptional subunit 37e (spot 559, 560) was reduced (Table 3). This protein catalyzes ribonucleic acid transcription, and the synthesis of mRNA, hnRNA, and microRNA precursors [63,64]. In addition, we found that the abundance of auxin-binding protein ABP19a were up-regulated in annual (spot 318 and 322) and perennial ryegrass (spot 485) under salt stress (Table 2 and Table 3). Auxin-binding proteins (ABPs) are a class of low abundance proteins in plants that bind active auxins with high specificity and affinity. It is possible that ABP could initiate the auxin signal pathways, leading to various cellular responses through ABP-auxin binding, which would thus accord it with a plant hormone receptor function [65]. The ABP19a is located on the plasma membrane and binds to auxin to activate the auxin signal pathways and regulating plant cell formation [66]. The up-regulated of ABP-19a in annual and perennial ryegrass under salt stress indicated that in ryegrass the auxin signal pathways are activated both in annual and perennial ryegrass to response salt stress, which could alleviate the growth inhibition caused by salt stress.

5. Conclusions

Although annual ryegrass and perennial ryegrass are similar in many regards, even at the genomic level, they have very different uses (annual ryegrass for foraging and perennial ryegrass for turf purposes). In brief, this study reported, for the first time, the physiological and molecular response mechanisms of these two-ryegrass species to salt stress during the seedling stage. The results clearly showed that salt stress reduced growth and photosynthesis in the seedlings of both species, but annual ryegrass was inhibited to a larger degree. In addition, proteomic analysis revealed 33 and 37 differentially accumulated proteins in annual and perennial ryegrass, respectively, under salinity stress. Under salt stress, TCA cycle, pentose phosphate pathway, genetic information process, and amino acid metabolism were all decreased both in annual and perennial ryegrass. In addition, glycolysis, ATP synthesis, and photosynthesis reflected significant differences between annual and perennial ryegrass in response to salt stress. These findings provide new insights into physiological mechanisms by which annual ryegrass and perennial ryegrass respond salt stress.

Supplementary Materials

The following are available online at https://www.mdpi.com/2073-4395/9/12/843/s1, Supplementary Material 1: Mass Spectrometry Analysis Results; Figure S1: Map of annual ryegrass (A, B) and perennial ryegrass (C, D) protein spots. Representative 2-DE gels of protein samples from annual ryegrass and perennial ryegrass seedlings without salinity treatment (A, C) and 200 mM NaCl treatment (B, D). The statistically significant differential spots are labeled with arrows and match IDs, red and green arrows indicate increased and reduced abundance of protein spots, respectively.; Figure S2: Map of annual ryegrass (A, B) and perennial ryegrass (C, D) protein spots. Representative 2-DE gels of protein samples from annual ryegrass and perennial ryegrass seedlings without salinity treatment (A, C) and 200 mM NaCl treatment (B, D). The statistically significant differential spots are labeled with arrows and match IDs, red and green arrows indicate increased and reduced abundance of protein spots, respectively.

Author Contributions

X.P. did the experiment and wrote the manuscript. D.Y. analyzed the data. J.Y. did a part of experiment. N.Z. gave some good suggestions on the manuscript. J.L. designed this experiment and revised the manuscript. J.W. revised the manuscript and provided the funds support.

Acknowledgments

The research was supported by the Fundamental Research Funds for the Central Universities (2572018BS02), the National Natural Science Foundation of China (31800546) and Natural Science Research Project of Colleges and Universities in Jiangsu Province (19KJB170022).

Conflicts of Interest

The authors declare no conflict of interest.

References

  1. Humphreys, M.; Feuerstein, U.; Vandewalle, M.; Baert, J. Fodder Crops and Amenity Grasses; Boller, B., Posselt, F.U., Eds.; Veronesi: Dordrecht, The Netherlands, 2010; pp. 211–260. [Google Scholar]
  2. Pan, L.; Yang, Z.F.; Wang, J.P.; Wang, P.X.; Ma, X.; Zhou, M.L.; Li, J.; Nie, G.; Feng, G.Y.; Zhao, J.M.; et al. Comparative proteomic analyses reveal the proteome response to short-term drought in Italian ryegrass (Lolium multiflorum). PLoS ONE 2017, 12, e0184289. [Google Scholar] [CrossRef] [PubMed]
  3. Lin, J.X.; Hua, X.Y.; Peng, X.Y.; Dong, B.L.; Yan, X.F. Germination Responses of Ryegrass (Annual vs. Perennial) Seed to the Interactive Effects of Temperature and Salt-Alkali Stress. Front. Plant Sci. 2018, 9, 1458. [Google Scholar] [CrossRef] [PubMed]
  4. Li, J.; Xu, Y.H.; Fei, S.; Li, L.J. Isolation, characterization and evolutionary analysis of resistance gene analogs in annual ryegrass, perennial ryegrass and their hybrid. Physiol. Plant. 2006, 126, 627–638. [Google Scholar] [CrossRef]
  5. Xiong, Y.W.; Fei, S.Z.; Arira, R.; Brummer, E.C.; Barker, R.E.; Jung, G.; Warnke, S.E. Identification of quantitative trait loci controlling winter hardiness in an annual×perennial ryegrass interspecific hybrid population. Mol. Breed. 2007, 19, 125–136. [Google Scholar] [CrossRef]
  6. Saddhe, A.A.; Malvankar, M.R.; Karle, S.B.; Kumar, K. Reactive nitrogen species: Paradigms of cellular signaling and regulation of salt stress in plants. Environ. Exp. Bot. 2019, 161, 86–97. [Google Scholar] [CrossRef]
  7. Agarwal, P.; Agarwal, P.K.; Gohil, D. Salinity Responses and Tolerance in Plants; Kumar, V., Wani, S., Suprasanna, P., Tran, L.S., Eds.; Springer: Cham, Switzerland, 2018; pp. 185–211. [Google Scholar]
  8. Fan, P.; Feng, J.; Jiang, P.; Chen, X.; Bao, H.; Nie, L.; Jiang, D.; Lv, S.; Kuang, T.; Li, Y. Coordination of carbon fixation and nitrogen metabolism in Salicornia europaea under salinity: Comparative proteomic analysis on chloroplast proteins. Proteomics 2011, 11, 4346–4367. [Google Scholar] [CrossRef] [PubMed]
  9. Dubouzet, J.G.; Sakuma, Y.; Ito, Y.; Kazuko, M.; Dubouzet, E.G.; Miura, S.; Seki, M.; Shinozaki, K.; Yamaguchi-Shinozaki, K. OsDREB genes in rice, Oryza sativa L., encode transcription activators that function in drought-, high-salt-and cold-responsive gene expression. Plant J. 2003, 33, 751–763. [Google Scholar] [CrossRef]
  10. Parida, A.K.; Das, A.B. Salt tolerance and salinity effects on plants: A review. Ecotox. Environ. Saf. 2005, 60, 324–349. [Google Scholar] [CrossRef]
  11. Li, M.N.; Zhang, K.; Long, R.C.; Sun, Y.; Kang, J.M.; Zhang, T.J.; Cao, S.H. iTRAQ-based comparative proteomic analysis reveals tissue-specific and novel early-stage molecular mechanisms of salt stress response in Carex rigescens. Environ. Exp. Bot. 2017, 143, 99–114. [Google Scholar] [CrossRef]
  12. Hu, T.; Li, H.Y.; Zhang, X.Z.; Luo, H.J.; Fu, J.M. Toxic effect of nacl on ion metabolism, antioxidative enzymes and gene expression of perennial ryegrass. Ecotox. Environ. Saf. 2011, 74, 2050–2056. [Google Scholar] [CrossRef]
  13. Hu, L.; Li, H.; Pang, H.; Fu, J. Responses of antioxidant gene, protein and enzymes to salinity stress in two genotypes of perennial ryegrass (Lolium perenne) differing in salt tolerance. J. Plant Physiol. 2012, 169, 0156. [Google Scholar] [CrossRef] [PubMed]
  14. Cao, L.; Wei, S.Q.; Han, L.; Qian, Y.Q.; Zhang, H.L.; Xin, H.B.; Sun, Z.Y. Gene cloning and expression of the pyrroline-5-carboxylate reductase gene of perennial ryegrass (Lolium perenne). Horticult. Plant J. 2015, 1, 113–120. [Google Scholar]
  15. Chen, Y.Y.; Lu, P.Z.; Sun, P.; Wei, L.; Chen, G.L.; Wu, D. Interactive salt—alkali stress and exogenous Ca2+, effects on growth and osmotic adjustment of, Lolium multiflorum, in a coastal estuary. Flora 2017, 229, 92–99. [Google Scholar] [CrossRef]
  16. Deshmukh, R.; Sonah, H.; Patil, G.; Chen, W.; Prince, S.; Mutava, R.; Vuong, T.; Valliyodan, B.; Nguyen, H.T. Integrating omic approaches for abiotic stress tolerance in soybean. Front. Plant Sci. 2014, 5, 244. [Google Scholar] [CrossRef] [PubMed]
  17. Wang, Y.N.; Peng, X.Y.; Salvato, F.; Wang, Y.C.; Yan, X.F.; Zhou, Z.Q.; Lin, J.X. Salt-adaptive strategies in oil seed crop Ricinus communis early seedlings (cotyledon vs. true leaf) revealed from proteomics analysis. Ecotox. Environ. Saf. 2019, 171, 12–25. [Google Scholar] [CrossRef]
  18. Yu, J.J.; Chen, S.X.; Zhao, Q.; Wang, T.; Yang, C.P.; Diaz, C.; Sun, G.R.; Dai, S.J. Physiological and proteomic analysis of salinity tolerance in Puccinellia Tenuiflora. J. Proteome Res. 2011, 10, 3852–3870. [Google Scholar] [CrossRef]
  19. Swami, A.K.; Alam, S.I.; Sengupta, N.; Sarin, R. Differential proteomic analysis of salt stress response in Sorghum bicolor leaves. Environ. Exp. Bot. 2011, 71, 321–328. [Google Scholar] [CrossRef]
  20. Cui, D.; Wu, D.; Liu, J.; Li, D.T.; Xu, C.Y.; Li, S.; Li, P.; Zhang, H.; Liu, X.; Jiang, C.; et al. Proteomic analysis of seedling roots of two maize inbred lines that differ significantly in the salt stress response. PLoS ONE 2015, 10, e0116697. [Google Scholar] [CrossRef]
  21. Pang, Q.Y.; Zhang, A.Q.; Zang, W.; Lei, W.; Yan, X.F. Integrated proteomics and metabolomics for dissecting the mechanism of global responses to salt and alkali stress in suaeda corniculata. Plant Soil. 2016, 402, 379–394. [Google Scholar] [CrossRef]
  22. Li, J.; Cui, G.; Hu, G.; Wang, M.; Zhang, P.; Qin, L. Proteome dynamics and physiological responses to short-term salt stress in Leymus chinensis leaves. PLoS ONE 2017, 12, e0183615. [Google Scholar] [CrossRef]
  23. Singh, R.P.; Runthala, A.; Khan, S.; Jha, P.N. Quantitative proteomics analysis reveals the tolerance of wheat to salt stress in response to enterobacter cloacae sbp-8. PLoS ONE 2017, 12, e0183513. [Google Scholar] [CrossRef] [Green Version]
  24. Jiang, Q.; Li, X.; Niu, F.; Sun, X.; Hu, Z.; Zhang, H. Itraq-based quantitative proteomic analysis of wheat roots in response to salt stress. Proteomics 2017, 17, 1600265. [Google Scholar] [CrossRef] [PubMed]
  25. Luo, M.; Zhao, Y.; Wang, Y.; Shi, Z.; Zhang, P.; Zhang, Y. Comparative proteomics of contrasting maize genotypes provides insights into salt-stress tolerance mechanisms. J. Proteome Res. 2017, 17, 141–153. [Google Scholar] [CrossRef]
  26. Dong, K.; Zhen, S.M.; Cheng, Z.W.; Cao, H.; Ge, P.; Yan, Y.M. Proteomic analysis reveals key proteins and phosphoproteins upon seed germination of wheat (Triticum aestivum L.). Front. Plant Sci. 2015, 6, 1017. [Google Scholar] [CrossRef] [Green Version]
  27. Zhang, J.; Li, Q.; Qi, Y.P.; Huang, W.L.; Yang, L.T.; Lai, N.W.; Ye, X.; Chen, L.S. Low pH-responsive proteins revealed by a 2-DE based MS approach and related physiological responses in Citrus leaves. BMC Plant Biol. 2008, 18, 188. [Google Scholar] [CrossRef] [PubMed]
  28. Jia, X.M.; Wang, H.; Svetla, S.; Zhu, Y.F.; Hu, Y.; Cheng, L.; Zhao, T.; Wang, Y.X. Comparative physiological responses and adaptive strategies of apple Malus halliana to salt, alkali and saline-alkali stress. Sci. Hortic. 2019, 245, 154–162. [Google Scholar] [CrossRef]
  29. Sun, L.L.; Xu, H.L.; Hao, H.D.; An, S.H.; Lu, C.T.; Wu, R.H.; Su, W.C. Effects of bensulfuron-methyl residue on photosynthesis and chlorophyll fluorescence in leaves of cucumber seedlings. PLoS ONE 2019, 14, e0215486. [Google Scholar] [CrossRef] [Green Version]
  30. Bates, L.S.; Waldren, R.P.; Teare, I.D. Rapid determination of free proline for water stress studies. Plant Soil. 1973, 39, 205–207. [Google Scholar] [CrossRef]
  31. Dubois, M.; Gilles, K.A.; Hamilton, J.K.; Rebers, P.A.; Smith, F. Colorimetric method for determination of sugars and related substances. Anal. Chem. 1956, 28, 350–356. [Google Scholar] [CrossRef]
  32. Yin, X.; He, D.; Gupta, R.; Yang, P. Physiological and proteomic analyses on artificially aged brassica napus seed. Front. Plant Sci. 2015, 6, 112. [Google Scholar]
  33. Sheffield, J.; Taylor, N.; Fauquet, C.; Chen, S. The cassava (Manihot esculenta Crantz) root proteome: Protein identification and differential expression. Proteomics 2006, 6, 1588–1598. [Google Scholar] [CrossRef]
  34. Yang, C.W.; Chong, J.N.; Li, C.Y.; Kim, C.M.; Shi, D.C.; Wang, D.L. Osmotic adjustment and ion balance traits of an alkali resistant halophyte Kochia sieversiana, during adaptation to salt and alkali conditions. Plant Soil. 2007, 294, 263–276. [Google Scholar] [CrossRef]
  35. Chaves, M.M.; Flexas, J.; Pinheiro, C. Photosynthesis under drought and salt stress: Regulation mechanisms from whole plant to cell. Ann. Bot. 2008, 103, 551–560. [Google Scholar] [CrossRef] [PubMed] [Green Version]
  36. Jiang, Y.P.; Ding, X.T.; Zhang, D.; Deng, Q.; Yu, C.L.; Zhou, S.P.; Hui, D.F. Soil salinity increases the tolerance of excessive sulfur fumigation stress in tomato plants. Environ. Exp. Bot. 2017, 133, 70–77. [Google Scholar] [CrossRef] [Green Version]
  37. Mian, A.; Oomen, R.J.F.J.; Isayenkov, S.; Sentenac, H.; Maathuis, F.J.; Maathuis, F.J.M.; Véry, A.A. Over-expression of an Na+- and K+- permeable HKT transporter in barley improves salt tolerance. Plant J. 2011, 68, 468–479. [Google Scholar] [CrossRef]
  38. Li, X.Y.; Liu, J.J.; Zhang, Y.T.; Lin, J.X.; Mu, C.S. Physiological responses and adaptive strategies of wheat seedlings to salt and alkali stresses. Soil Sci. Plant Nutr. 2009, 55, 680–684. [Google Scholar] [CrossRef]
  39. Yang, C.W.; Xu, H.H.; Wang, L.L.; Liu, J.; Shi, D.C.; Wang, D.L. Comparative effects of salt-stress and alkali-stress on the growth, photosynthesis, solute accumulation, and ion balance of barley plants. Photosynthetica 2009, 47, 79–86. [Google Scholar] [CrossRef]
  40. Wang, X.; Fan, P.; Song, H.; Chen, X.; Li, X.; Li, Y. Comparative proteomic analysis of differentially expressed proteins in shoots of Salicornia europaea under different salinity. J. Proteome Res. 2009, 8, 3331–3345. [Google Scholar] [CrossRef]
  41. Swart, C.; Zhang, Y.; Kfm, B.; Bergmann, S.; Krahnert, I.; Nikoloski, Z. Protein-protein interactions and metabolite channeling in the plant tricarboxylic acid cycle. Nat. Commun. 2017, 8, 1–11. [Google Scholar]
  42. Chen, Z.; Sun, L.; Liu, P.; Liu, G.; Tian, J.; Liao, H. Malate synthesis and secretion mediated by a manganese-enhanced malate dehydrogenase confers superior manganese tolerance in Stylosanthes guianensis. Plant Physiol. 2015, 167, 176–188. [Google Scholar] [CrossRef] [Green Version]
  43. Kianipouya, A.; Roessner, U.; Jayasinghe, T.; Bazihizina, N. Epidermal bladder cells confer salinity stress tolerance in the halophyte quinoa and Atriplex species. Plant Cell Environ. 2017, 40, 1900–1915. [Google Scholar] [CrossRef] [PubMed] [Green Version]
  44. Stincone, A.; Prigione, A.; Cramer, T.; Wamelink, M.M.C.; Campbell, K.; Cheung, E.; Olin-Sandoval, V.; Grüning, N.M.; Krüger, A.; Alam, M.T.; et al. The return of metabolism: Biochemistry and physiology of the pentose phosphate pathway. Biol. Rev. Camb. Philos. Soc. 2014, 90, 927–963. [Google Scholar] [CrossRef] [PubMed] [Green Version]
  45. Foyer, C.H.; Bloom, A.J.; Queval, G.; Noctor, G. Photorespiratory metabolism: Genes, mutants, energetics, and redox signaling. Ann. Rev. Plant Biol. 2009, 60, 455–484. [Google Scholar] [CrossRef] [PubMed]
  46. Kochetov, G.A.; Solovjeva, O.N. Sructure and functioning mechanism of transketolase. Ann. Rev. Plant Biol. 2014, 1844, 1608–1618. [Google Scholar]
  47. Hichem, H.; Naceur, A.E.; Mounir, D. Effects of salt stress on photosynthesis, PSII photochemistry and thermal energy dissipation in leaves oftwocorn (Zeamays, L.) varieties. Photosynthetica 2009, 47, 517–526. [Google Scholar] [CrossRef]
  48. Wang, J.Z.; Wang, J.; Wang, X.; Li, R.B.; Chen, B.S. Proteomic response of hybrid wild rice to cold stress at the seedling stage. PLoS ONE 2018, 13, e0198675. [Google Scholar] [CrossRef]
  49. Spreitzer, R.J.; Savucci, M.E. Rubisco: Structure, regulatory interactions and possibilities for a better enzyme. Ann. Rev. Plant Biol. 2002, 53, 449–485. [Google Scholar] [CrossRef] [Green Version]
  50. Ludwig, M. Evolution of carbonic anhydrase in C4 plants. Curr. Opin. Plant Biol. 2016, 31, 16–22. [Google Scholar] [CrossRef]
  51. Meng, X.J.; Zhao, Q.; Jin, Y.D.; Yu, J.J.; Yin, Z.P.; Chen, S.X.; Dai, S.J. Chilling-responsive mechanisms in halophyte puccinellia tenuiflora seedlings revealed from proteomics analysis. J. Proteom. 2016, 143, 365–381. [Google Scholar] [CrossRef]
  52. Meiri, E.; Levitan, A.; Guo, F.; Christopher, D.A.; Schaefer, D.; Zryd, J.-P.; Danon, A. Characterization of three PDI-like genes in Physcomitrella patens and construction of knock-out mutants. Mol. Genet. Genom. 2002, 267, 231–240. [Google Scholar]
  53. Askari, H.; Edqvist, J.; Hajheidari, M.; Kafi, M.; Salekdeh, G.H. Effects of salinity levels on proteome of Suaeda aegyptiaca leaves. Proteomics 2006, 6, 2542–2554. [Google Scholar] [CrossRef] [PubMed]
  54. Alam, I.; Sharmin, S.A.; Kim, K.H.; Yang, J.K.; Choi, M.S.; Lee, B.H. Proteome analysis of soybean roots subjected to short-term drought stress. Plant Soil. 2010, 333, 491–505. [Google Scholar] [CrossRef]
  55. Denison, F.C.; Paul, A.L.; Zupanska, A.K.; Ferl, R.J. 14-3-3 proteins in plant physiology. Semin. Cell Dev. Biol. 2011, 22, 720–727. [Google Scholar] [CrossRef]
  56. Yu, H.T.; Wang, T. Proteomic dissection of endosperm starch granule associated proteins reveals a network coordinating starch biosynthesis and amino acid metabolism and glycolysis in rice endosperms. Front. Plant Sci. 2016, 7, 707. [Google Scholar] [CrossRef] [PubMed]
  57. Wang, N.B.; Zhao, J.; He, X.Y.; Sun, H.Y.; Zhang, G.P.; Wu, F.B. Comparative proteomic analysis of drought tolerance in the two contrasting Tibetan wild genotypes and cultivated genotype. BMC Genom. 2015, 16, 432. [Google Scholar] [CrossRef] [PubMed] [Green Version]
  58. Ruiz, J.; Blumwald, E. Salinity-induced glutathione synthesis inbrassica napus. Planta (Berlin) 2002, 214, 965–969. [Google Scholar] [CrossRef]
  59. Stotz, H.U.; Long, S.R. Expression of the pea (pisum sativum L.) α-tubulin gene tuba1 is correlated with cell division activity. Plant Mol. Biol. 1999, 41, 601–614. [Google Scholar] [CrossRef] [PubMed]
  60. Assmann, S.M. G proteins go green: A plant G protein signaling FAQ sheet. Science 2005, 310, 71–73. [Google Scholar] [CrossRef] [Green Version]
  61. Lv, D.W.; Zhu, G.R.; Zhu, D.; Bian, Y.W.; Liang, X.N.; Cheng, Z.W.; Deng, X.; Yan, Y.M. Proteomic and phosphoproteomic analysis reveals the response and defense mechanism in leaves of diploid wheat T. monoccum under salt stress and recovery. J. Proteom. 2016, 143, 93–105. [Google Scholar] [CrossRef]
  62. Carter, C.; Thornburg, R.W. Germin-like proteins: Structure, phylogeny and function. J. Plant Biol. 1999, 42, 97–108. [Google Scholar] [CrossRef]
  63. Tan-Wong, S.M.; Zaugg, J.B.; Camblong, J.; Xu, X.Y.; Zhang, D.W.; Mischo, H.E.; Ansari, A.Z.; Luscombe, N.M.; Steinmetz, L.M.; Proudfoot, N.J. Gene loops enhance transcriptional directionality. Science 2012, 338, 671–675. [Google Scholar] [CrossRef] [Green Version]
  64. Wyers, F.; Rougemaille, M.; Badis, G.; Rousselle, J.C.; Dufour, M.E.; Boulay, J.; Regnault, B.; Devaux, F.; Namane, A.; Seraphin, B.; et al. Cryptic pol II transcripts are degraded by a nuclear quality control pathway involving a new poly(A) polymerase. Cell 2005, 121, 725–737. [Google Scholar] [CrossRef] [Green Version]
  65. Peinado-Guevara, L.I.; López-Meyer, M.; López-Valenzuela, J.A.; Maldonado-Mendoza, I.E.; Galindo-Flores, H.; Campista-León, S.; Medina, S. Comparative proteomic analysis of leaf tissue from tomato plants colonized with rhizophagus irregularis. Symbiosis 2017, 73, 93–106. [Google Scholar] [CrossRef]
  66. Xu, T.D.; Wen, M.Z.; Nagawa, S.; Fu, Y.; Chen, J.G.; Wu, M.J.; Perrot-Rechenmann, C.; Friml, J.; Jones, A.M.; Yang, Z.B. Cell surface- and rho GTPase-based auxin signaling controls cellular interdigitation in Arabidopsis. Cell 2010, 143, 99–110. [Google Scholar] [CrossRef] [PubMed] [Green Version]
Figure 1. Apparent quantum yield of PS II, (Fv/Fm) (A,B), actual quantum yield of photochemical energy conversion in PS II (ΦPS II) (C,D), non-photochemical quenching coefficient (NPQ) (E,F), and photochemical quenching coefficient (qp) (G,H), in the seedlings of annual ryegrass and perennial ryegrass under salinity. Different letters indicate a significant difference in seedlings among salt concentrations. The differences in each parameter were detected by one-way ANOVA at p < 0.05 level. Bars represent mean ± Standard Error (SE).
Agronomy 09 00843 g001
Figure 2. The Na+ (A,B), K+ (C,D), proline (E,F), and soluble sugar contents (G,H), in the seedlings of annual ryegrass and perennial ryegrass under salinity. Different letters indicate a significant difference in seedlings among salt concentrations of annual ryegrass and perennial ryegrass. The differences in each parameter were detected by one-way ANOVA at p < 0.05 level. Bars represent mean ± Standard Error (SE).
Agronomy 09 00843 g002
Figure 3. Map of annual ryegrass (A,B), and perennial ryegrass (C,D), protein spots. Representative 2-DE gels of protein samples from annual ryegrass and perennial ryegrass seedlings without salinity treatment (A,C), and 200 mM NaCl treatment (B,D). The statistically significant differential spots are labeled with arrows and match IDs; red and green arrows indicate increased and reduced abundance of protein spots, respectively.
Agronomy 09 00843 g003
Figure 4. Functional classification of different expressed proteins in annual ryegrass (A) and perennial ryegrass (B) under salt stress. Venn diagram analysis of annual ryegrass and perennial ryegrass under salt stress (C). Diagram showed annual ryegrass and perennial ryegrass proteins changed in abundance under salt stress. The overlapping area showed the common protein to both annual ryegrass and perennial ryegrass, where different colors indicated different accumulation in the common protein in both annual ryegrass and perennial ryegrass. Among them, red indicated up-regulation and green expression was down-regulated.
Agronomy 09 00843 g004
Figure 5. Schematic view of differentially accumulated proteins involved in key metabolic pathways in annual and perennial ryegrass seedlings under salinity stress. Each protein is represented by an ellipse, the protein with increased abundance is red, and the protein with reduced abundance is green. FBA, fructose-bisphosphate aldolase; PKG, phosphoglycerate kinase; OEC, oxygen-evolving complex; OEE, oxygen-evolving enhancer protein; CA, carbonic anhydrase; RuBisCo, ribulose-1,5-bisphosphate carboxylase/oxygenase; RuBP, ribulose-1,5-bisphosphate; GADPH, glyceraldehyde3-phosphatedehydrogenase; EF-Tu, elongation factor Tu; TCA cycle, tricarboxylic acid cycle; SDH, succinate dehydrogenase; GST, glutathione S-transferase.
Agronomy 09 00843 g005
Table 1. Growth parameters of annual ryegrass and perennial ryegrass seedlings under salinity stress.
Annual RyegrassPerennial Ryegrass
Control100 mM200 mMControl100 mM200 mM
Fresh weight (g·plant−1)0.3295 ± 0.0196 c0.2243 ± 0.0134 b0.1432 ± 0.0139 a0.2484 ± 0.0098 b0.1223 ± 0.0122 a0.0905 ± 0.0113 a
Dry weight (g·plant−1)0.0412 ± 0.0012 c0.0296 ± 0.0036 b0.0221 ± 0.0020 a0.0301 ± 0.0014 c0.0198 ± 0.0016 b0.0211 ± 0.0034 a
Different letters indicate a significant difference among different salt concentrations. The differences in each parameter were detected by one-way ANOVA at p < 0.05 level. Bars represent mean ± Standard Error (SE).
Table 2. Different expressed protein spots in annual ryegrass seedlings under treatment with 200 mM NaCl.
Spot No. aAccession No. bProtein NamePlant Species cThero kD/pI dScore eSequence Coverage fPeptides Matched gFold Changesp-Value
Carbohydrate and Energy Metabolism (9)
TCA Cycle
184I1IYJ8Betaine aldehyde dehydrogenaseBrachypodium distachyon53.35/5.466371−2.10.05
349A0A287E122Succinate dehydrogenase Hordeum vulgare subsp. vulgare57.21/5.96264113−2.080.03
Glycolysis
112A0A0Q3LKL4Glyceraldehyde-3-phosphate dehydrogenaseBrachypodium distachyon47.65/6.033711233.80.02
337A0A3B6RIU4Fructose-bisphosphate aldolase, cytosolicTriticum aestivum41.46/5.856231−2.550.01
186K6ZY00Phosphoglycerate mutasePhleum pratense32.25/5.682991421.680.04
ATP Synthesis
338A0A2X0TKP9ATP synthase subunitTriticum aestivum40.12/8.13417214−1.830.01
Pentose Phosphate Pathway
327A0A287PP03Ribulose-phosphate 3-epimeraseHordeum vulgare subsp. vulgare29.21/8.29508254−2.230.01
328A0A2X0TSQ1Ribose-5-phosphate isomerase 3Triticum aestivum29.62/6.34600304−1.620.05
341A0A077RWS5S-adenosylmethionine synthaseTriticum aestivum43.28/5.61512174−1.760.04
Photosynthesis (11)
Photosynstem Ⅱ
324A0A164ZG13Chlorophyll a-b binding proteinDaucus carota subsp. sativus26.49/5.966141−3.570.01
325A0A0E0AJY3Photosystem II extrinsic subunitOryza glumipatula27.35/8.56111111−1.530.03
48A0A287I5I5Oxygen-evolving enhancer protein 2Hordeum vulgare subsp. vulgare20.68/5.752312121.670.01
Electron Transfer Chain
345I1I2I7Photosynthetic NDH subunit of subcomplex B1Brachypodium distachyon52.12/6.3614881−1.920.05
Calvin Cycle
340A0A067L8Y9Ribulose bisphosphate carboxylase/oxygenase activaseJatropha curcas52.21/5.56284103−1.680.01
315Q9SP00Ribulose-1,5-bisphosphate carboxylase/oxygenase small chainAvena agadiriana19.08/8.59250202−1.370.02
316Q9SP00Ribulose-1,5-bisphosphate carboxylase/oxygenase small chainAvena agadiriana19.08/8.597371−1.10.01
317U5YI33Ribulose-1,5-bisphosphate carboxylase/oxygenase large chainSarcochlamys pulcherrima25.79/6.3320481−1.630.03
330P0C510Ribulose-1.5-bisphosphate carboxylase/oxygenase large chainOryza sativa53.42/0.51447123−2.10.03
308A0A0D3GC12Ribulose-1.5-bisphosphate carboxylase/oxygenase large subunit-binding protein subunit betaOryza barthii64.3/5.620172−4.940.01
326A0A0Q3GCH7Carbonic anhydraseBrachypodium distachyon30.33/6.81422244−2.550.01
Genetic Information Process (3)
343A0A0J7YLM1Elongation factor Tu (Fragment)Beta vulgaris subsp. vulgaris44.45/5.2411741−1.630.01
344A0A0J7YLM1Elongation factor Tu (Fragment)Beta vulgaris subsp. vulgaris44.45/5.249241−1.390.04
346F8SVL8Elongation factor 1 (Fragment)Phalaenopsis hybrid cultivar44.29/9.19207141−1.960.01
Amino Acid Metabolism (1)
63A0A165FYU2Glutathione-S-transferaseLolium perenne25.57/5.71342233−2.630.04
Stress and Defense (5)
312I1IAA52-Cys peroxiredoxin BAS1Brachypodium distachyon28.51/6.43190414−1.850.02
310I1I6Q92-methylene-furan-3-one reductaseBrachypodium distachyon39.84/8.29233102−1.570.02
320A0A1E5VJG5Germin-like protein 8-14Dichanthelium oligosanthes21.89/5.69249162−1.770.04
318A0A059BYP6Auxin-binding protein ABP19aEucalyptus grandis21.76/8.931831112.040.01
322A0A059BYP6Auxin-binding protein ABP19aEucalyptus grandis21.76/8.931191111.90.01
Protein Synthesis, Folding and Destination (3)
339A0A287P2Y930S ribosomal protein S1Hordeum vulgare subsp. vulgare443.45/4.67264134−3.640.01
351A0A2K2D841Protein translocase subunit SecABrachypodium distachyon111.44/5.8247696−2.590.01
354A0A0D3EN60Protein translocase subunit SecAOryza barthii111.53/5.795531−1.730.02
Others (1)
333A0A0D3EUB5Hypothetical protein OsI_03835Oryza barthii56.86/9.097451−2.960.02
a Assigned spot number as indicated in Figure 4A. b Database access ion numbers according to NCBInr. c The plant species that matched the peptides. d The oretical mass (kDa) and pI of identified proteins. The oretical values were retrieved from the protein database. e Mascot score reported after searching against the NCBInr database. f The amino acid sequence coverage for the identified proteins. g The number of unique peptides identified for each protein.
Table 3. Different expressed protein spots in perennial ryegrass seedlings under treatment with 200 mM NaCl.
Spot No aAccession No bProtein NamePlant Species cThero kD/pI dScore eSequence Coverage fPetides Matched gFold Changesp-Value
Carbohydrate and Energy Metabolism (10)
Glycolysis
515A0A287QT87Fructose-bisphosphate aldolase, cytosolicHordeum vulgare subsp. vulgare41.85/6.3913182−1.240.01
517A0A0D3H2L3Pyruvate dehydrogenase E1 component subunit betaOryza barthii40.18/5.35342134−1.480.01
532I1HI25Phosphoglycerate kinaseBrachypodium distachyon50.19/6.99598174−1.770.02
556A0A397Y6S9Probable phosphoglucomutaseBrassica campestris63.61/5.8414731−1.530.01
567A0A0D3GDS1Sucrose synthaseOryza barthii92.61/5.968221−4.790.01
ATP Synthesis
258A0A2L0VAS4ATP synthase subunit alphaLamarckia aurea55.76/6.118152271.640.05
479K4PA35ATP synthase CF1 epsilon subunitLolium multiflorum15.26/5.25612715−2.210.01
553A9L9Y6ATP synthase subunit betaFestuca arundinacea52.99/5.17211151−2.210.01
Pentose Phosphate Pathway
324A0A194YGV9TransketolaseSorghum bicolor79.92/6.0024262−1.270.05
562A0A194YGV9TransketolaseSorghum bicolor79.92/6.0021662−1.840.01
Photosynthesis (5)
278A0A287VF44Ribulose-1.5-bisphosphate carboxylase/oxygenase large subunit-binding protein subunit betaHordeum vulgare subsp. vulgare59.69/5.025871662.430.02
480A0A0U1XKS7Ribulose-1,5-bisphosphate carboxylase/oxygenase large subunitPolypogon fugax2.978/4.08935311.890.01
531A0A067L8Y9Ribulose-1,5-bisphosphate carboxylase/oxygenase activaseJatropha curcas52.21/5.56330103−1.730.01
535A0A075M0L1Ribulose-1,5-bisphosphate carboxylase large chainBrachiaria serrata50.08/6.65702051.340.01
496A0A059Q285Carbonic anhydraseSaccharum hybrid cultivar22.77/7.66681−2.560.01
Genetic Information Process (2)
564A0A0Q3E7E5Elongation factor GBrachypodium distachyon84.23/5.25869177−2.860.01
579A0A067JM98Elongation factor 2Jatropha curcas94.99/5.926793−2.640.04
Amino Acid Metabolism (6)
61A0A0D3ER48GTP-binding nuclear proteinOryza barthii25.33/6.3857141−2.760.02
162C5IW60Glutamine synthetaseLolium perenne38.97/5.5916491−1.370.04
534Q0WV25Tubulin alpha-4 chainArabidopsis thaliana50.19/4.939181−1.530.01
549A0A287R7K7Serine/threonine-protein phosphatase 2A 65 kDa regulatory subunit A beta isoformHordeum vulgare subsp. vulgare66.23/4.95417183−1.920.01
476Q9LKM0Nucleoside diphosphate kinaseLolium perenne16.49/6.3441334−2.560.01
555A0A341Y4U2vacuolar proton-ATPase subunit ATriticum aestivum68.09/5.19521135−4.580.02
Stress and Defense (7)
130A0A3B6NMG82-methylene-furan-3-one reductaseTriticum aestivum40.01/7.6331592−1.40.02
477A0A3B6KDF0Thioredoxin M-typeTriticum aestivum19.66/8.6710691−1.680.03
510A0A368Q639Thiamine thiazole synthaseSetaria italica40.87/6.002721223.480.04
559A0A3B6KDM7Probable mediator of RNA polymerase II transcription subunit 37eTriticum aestivum71.43/5.07930208−2.860.01
560A0A3B6LHE6Probable mediator of RNA polymerase II transcription subunit 37eTriticum aestivum71.43/5.07556135−1.670.02
102A0A0D9VL60AnnexinLeersia perrieri31.81/6.778191−2.740.02
485A0A059BYP6auxin-binding protein ABP19aEucalyptus grandis21.76/8.931641111.750.01
Protein Synthesis, Folding and Destination (4)
491A0A287U0T750S ribosomal protein L21Hordeum vulgare subsp. vulgare25.87/9.63260243−1.680.03
547A0A024FR39Protein disulfide-isomeraseTriticum aestivum53.99/5.120091−2.550.02
550A0A0D3HJ84Protein disulfide-isomeraseOryza barthii57.06/4.928631−1.530.01
572A0A3B6KF51Chaperone protein ClpC2Triticum aestivum102.03/6.5542395−1.730.04
Signal Transduction (1)
507A0A0D9ZCC014-3-3-like protein GF14-FOryza glumipatula29.24/4.81448284−4.630.01
Others (2)
503A0A0D9X940Haloacid dehalogenase-like hydrolase domain-containing protein At4g39970Leersia perrieri35.38/6.23216112−1.950.03
505A0A1D5UQE8Haloacid dehalogenase-like hydrolase domain-containing protein At4g39970Triticum aestivum34.99/5.89314203−2.350.01
a Assigned spot number as indicated in Figure 4C. b Database access ion numbers according to NCBInr. c The plant species that matched the peptides. d The oretical mass (kDa) and pI of identified proteins. The oretical values were retrieved from the protein database. e Mascot score reported after searching against the NCBInr database. f The amino acid sequence coverage for the identified proteins. g The number of unique peptides identified for each protein.

