Article

Influence of Harvesting Time on Phenolic and Mineral Profiles and Their Association with the Antioxidant and Cytotoxic Effects of Atractylodes japonica Koidz

1
Department of Crop Science, College of Sanghuh Life Science, Konkuk University, Seoul 05029, Korea
2
Bioherb Research Institute, Kangwon National University, Chuncheon 24341, Korea
3
Research Institute of Biotechnology, Hwajin Bio Cosmetics CO., LTD, Chuncheon 24232, Korea
*
Author to whom correspondence should be addressed.
Agronomy 2021, 11(7), 1327; https://doi.org/10.3390/agronomy11071327
Submission received: 28 April 2021 / Revised: 24 June 2021 / Accepted: 24 June 2021 / Published: 29 June 2021

Abstract

:
Plant phytochemical accumulation is influenced by various external factors that change with the seasons (e.g., harvesting time). Atractylodes japonica, an important medicinal plant rich in bioactive compounds, is used to treat several human diseases. We analyzed the influence of harvesting time on phenolic compound concentration and antioxidant activity of A. japonica roots. We investigated the correlation between phenolic compound and minerals contents and antioxidant activity in different harvests. Total phenolic and flavonoid contents varied significantly with the harvesting time. Liquid chromatography–mass spectrometry/mass spectrometry (LC–MS/MS) analysis revealed significant changes in the concentration of various phenolics between harvests. The content of different types of phenolics were significantly higher in the samples collected in October. Among them, chlorogenic acids (133,833.30 µg/g dry weight of root extract) were the most dominant phytochemical compounds detected. Samples harvested in October had higher concentrations of flavonoids, including rutin, orientin, vitexin, and apigenin. Roots harvested in October had a significantly higher (p < 0.05) antioxidant activity than that of those harvested later. Root mineral concentrations also varied with the harvest time. The analysis revealed that macro elements such as Ca ad Mg contents were significantly increased with delaying harvesting time, whereas a different trend was observed for the microelements including Fe, Cu, Al, and As contents in the October harvest. We also found a significant relationship between antioxidant activity and phenolic compound content. The most abundant minerals (Ca, Mg, Mn, Fe, and Al) correlated positively with the antioxidant activity indicating that these elements and compounds may be associated with the A. japonica antioxidant potential. Furthermore, A. japonica root extracts inhibited NIH/3T3 cellular proliferation in a season- and dose-dependent manner. Hence, harvesting time influenced the antioxidant properties and phenolic compound accumulation of A. japonica roots. These results indicate that the harvesting time is essential for obtaining the specific phytochemicals.

1. Introduction

Atractylodes japonica Koidz. (Asteraceae) is a perennial plant native to North Asia, including Korea, China, and Japan [1,2,3]. In traditional medicine, this plant is widely used in the treatment of several human conditions, including pain, bronchitis [4], arthritis, digestive disorders, and water retention [1]. A. japonica extracts possess pharmaceutical properties, including antioxidant anti-inflammatory [5,6], analgesic [5], antimicrobial [7], diuretic (5; 6), and antivirus effects [8]. Additionally, they inhibit gastric ulcers [9] and promote distal colonic contraction in rats [10], and modulate the intestinal immune system [11]. Chemotaxonomic analyses in A. japonica roots revealed the presence of essential oils including sesquiterpenes [12], atractylone, 3-b-hydroxyatratylon, selina-4, hinesol, and b-eudesmol–and sesquiterpenoid glycosides [9,13], constituents which have important functional therapeutic activities. A. japonica roots are also rich in sesquiterpenolides [13,14] and diacetylatractylodiol and its derivatives [9]. Recently, studies on A. japonica phytochemistry and biological activity have intensified due to its abundance in bioactive components with biomedical interest, including atractylenolides I (AT-I) and III (AT-III), flavone C-glucosides, isoorientin, vitexin, and isovitexin. Furthermore, several studies have attributed health benefits to various secondary metabolites that have been isolated from A. japonica rhizomes, including monoterpene glycosides, aromatic glycosides, sucrose esters, and steroids [7,13,15].
Phenolic compounds are widely distributed among plant species. Previous studies showed that the consumption of polyphenol rich food contributes significantly to preventing health problems, including cancer and cardiovascular diseases [16,17], as they inhibit lipid peroxidation and lipoxygenase activity in vitro [18,19]. Additionally, they play an important role in neutralizing or sequestrating free radicals and chelating transition metals [18,19]. Minerals are the building blocks of tissues and are necessary for various metabolic processes [20]. They are also critical for maintaining the osmotic pressure and acid-base balance and muscle and nerve activities. Adequate Mn intake is vital because this element has an antioxidant activity that acts in ROS scavenging in cells [21]. Mg is present in chlorophyll and influences solar energy absorption by green plants [22]. Minerals, including Zn, Cu, Mn, and Fe, participate in the synthesis of secondary metabolites, which are responsible for antioxidant and antimicrobial activities in plants [22].
Several environmental factors, including harvesting time, influence bioactive compound and mineral production in plants [23,24]. The harvesting time of plant products directly affects the composition and concentration of bioactive compounds and minerals by changing growth and weather conditions to which plants are exposed [25]. Previous studies showed a close relationship between phytochemical composition and concentration and compound activity in plants. Plant samples of the same species collected at different seasons or with different harvesting times may have significant differences in their phytochemical and pharmacological properties [26,27,28]. To ensure high production and accumulation of desired bioactive compounds, it is necessary to identify the optimal harvesting season for different plant parts. However, the influence of harvest time on phenolic composition, antioxidant activity, and cytotoxic effects of A. japonica roots has not been studied. Furthermore, there are no reports of antioxidant activity and mineral composition and their relationship with seasonality and of phenolic compound metabolism.
Here, we investigated a possible correlation between harvesting time and phenolic compound and mineral contents in root with antioxidant activity. The objectives were to evaluate the changes in the phenolic compound and mineral contents, antioxidant activity, cytotoxicity, and their relationship in A. japonica root samples harvested at two different periods.

2. Materials and Methods

2.1. Chemicals

The Folin–Ciocalteu reagent, quercetin, butylated hydroxytoluene (BHT), 2,2-diphenyl-1-picrylhydrazyl (DPPH), and gallic acid (GA) were obtained from Sigma-Aldrich Chemical Co. (St. Louis, MO, USA). Hydrogen peroxide (H2O2) and nitric acid (HNO3) were purchased from Showa Chemical Industry Co. Ltd. (Tokyo, Japan). Ultrapure distilled water was obtained with a Zeneer power 1 system (Human Corporation, Seoul, Korea). The 19 multielement standards used in the analysis of micro- and macro elements were obtained from Perkin Elmer (Seoul, Korea). The multielement stock solutions were obtained from Quality Control Standard 26 (Inorganic Ventures, Christiansburg, VA, USA).

2.2. Cultivation of A. japonica

Seedlings of A. japonica were kindly provided by the Bio Herb Research Center, Kangwon National University and planted in the experimental field of Kangwon National University at Chuncheon, Kangwon-Do, South Korea located at 37°52′09.53″ N; 127°44′42.82″ E; 100 m altitude. There were eight seedlings of A. japonica assigned to each experimental plot. The experimental plots consisted of rows of 50 m in length, spaced 1.5 m apart with 1 m between the planted seedlings. The mean minimum and maximum field temperature during the cultivation period were 19 °C and 35 °C, respectively, with approximate rainfall rate of 200 mm. The sandy loam texture of the experimental field was maintained at pH of 6.1. The cultivated field was irrigated regularly once weekly by installing a drip-irrigation system. The recommended doses of compound chemical fertilizers were applied to the experimental field (Nitrogen: Phosphorus: Potassium = 15%: 15%: 15%) at a rate of 120 kg ha−1 before planting of the seedlings. Weeds were manually removed regularly during the seedling growth.

Sample Collection and Preparation of Plant Extracts

To investigate the phenolic compounds composition in the roots of A. japonica during the month of October and November, approximately 400 g of fresh and fully developed roots were sampled at first week of October and November 2018, 2019 and 2020. Each of the samples were randomly collected from five healthy and matured plants, which were mixed to form a root sample. The harvested root samples were thoroughly washed with distilled water and freeze-dried for one day. Furthermore, the root sample was crushed to the size of particles passing through a sieve (1 mm diameter). Briefly, 2 g of the freeze-dried finely ground samples were mixed with 20 mL of 80% methanol at room temperature (25 °C) with occasional mixing. Then, the extracts were filtered through filter paper (Whatman No. 1) and evaporated at 40 °C in a rotary evaporator (Eyela, SB-1300, Shanghai Eyela Co. Ltd., Shanghai, China). The obtained extracts were dissolved in 80% methanol (10 mL) and to obtain a solution of 50 µg/m. The extraction was conducted in triplicate per each root sample replicate and then the solution was filtered in a 0.45 µm filter unit before injection into the HPLC-MS/MS system.

2.3. Determination of Total Phenolic Contents (TPC)

The TPC of the A. japonica root extracts was determined in triplicate using the Folin–Ciocalteau reagent, as described by [29]. The analyzes were conducted in 10 mL test tubes, where 100 μL of diluted A. japonica root extract (1 mg mL−1), 50 μL of Folin–Ciocalteu reagent (1 M), and 1.85 mL of distilled water were mixed and incubated at room temperature (25 °C) for 4 min. Subsequently, 1.0 mL of saturated sodium carbonate (20% w/v) was added, and the tubes were vortexed slowly for 10 s, followed by the addition of distilled water to a final volume of 4 mL. Absorbance was measured after 1 h using a spectrophotometer (Jasco V530 UV-VIS spectrophotometer, Japan) at a wavelength of 725 nm against the blank. The measurements were compared with a GA calibration curve, and the results were expressed as GA equivalent (GAE) per gram of dry sample (mgGAEg−1).

2.4. Determination of Total Flavonoid Contents (TFC)

A. japonica root TFCs were quantified in triplicate using the aluminum chloride colorimetric method [30]. Briefly, 250 μL of diluted A. japonica root extract (1:3) was mixed with 100 µL of 10% aluminum nitrate and 100 µL of potassium acetate (KCH3COO) (1 M) in a 10 mL test tube. Then, 4.3 mL of 80% ethanol was added to achieve a final volume of 5 mL. The solution was mixed well and allowed to react for 5 min. The absorbance was measured at a wavelength of 410 nm using a spectrophotometer (Jasco V530 UV-VIS spectrophotometer, Tokyo, Japan). The TFC was expressed as the quercetin equivalent (QE) per gram of dry sample (mgQEg−1).

2.5. Quantification of Phenolic Compound Contents by Liquid Chromatography–Mass Spectrometry/Mass Spectrometry (LC–MS/MS)

The phenolic compound constituents were identified in A. japonica using an LC-MS/MS system following the method described by [31]. The HPLC system used in this study was from an Agilent HPLC System (Agilent Technologies, Santa Clara, CA, USA) Pumps (Agilent 1200, Agilent Technologies, Palo Alto, CA, USA) and an autosampler (G1313A) (Agilent 1100 series, Agilent Technologies, Palo Alto, CA, USA) coupled to an API 2000 mass spectrometer (Applied Biosystems, Ontario, Canada) were integrated to the LC system. A reversed-phase analytical column (C18, 4.6 × 150 mm, 5 μm) (Thermo Scientific™ Syncronis™, San Jose, CA, USA) was used for phenolic compound separation. The mobile phase consisted of 0.1% formic acid (v/v) in water (phase A) and 0.1% acetonitrile in water (95:5, v/v) (phase B). The following mobile phase gradient profile was set: 10–40% phase B for 0–10 min; 40–50% phase B for 10–20 min; 50–100% phase B for 20–25 min; 100–10% phase B for 25–26 min; and 10% phase B for 26–30 min. The column temperature was maintained at 25 °C. The mobile phase was programmed at the rate of 0.7 mL min−1, with an injection volume of 10 µL. The electrospray ion source (ESI) was used in negative mode under the multiple reaction monitoring (MRM) mode, with curtain gas pressure and collision gas pressure of 20 psi and 2 psi, respectively, capillary voltage of 4500 V, drying gas (nitrogen) pressure of 70 psi, and nebulizing pressure of 40 psi. The analyses were performed in triplicate.
Identification of the compounds was performed in MRM mode by comparing the retention times and m/z (mass-to-charge ratio) values of the molecular and product ions (Q1 and Q3 values (Table S1, See Supplementary File)) with the corresponding standard solutions. The stock solutions of standards were prepared by dissolving in the appropriate solvents by following their physical/chemical properties. The obtained standard solutions were used to construct their corresponding calibration curves. A quantitative analysis of the data and the external calibration curve was performed using Analyst software (version 1.6.2; AB Sciex, Framingham, MA, USA). All the obtained calibration curves exhibited good linearity (r2 = 0.99). The LOD and LOQ values were calculated with signal-to-noise (S/N) ratios of 3 and 10 (Table S2, See Supplementary File).

2.6. Antioxidant Activity

2.6.1. 1,1-Diphenyl–2-Picrylhydrazyl (DPPH) Radical Scavenging Assay

The antioxidant activity of A. japonica root extracts was determined using the DPPH radical scavenging assay following the method described before [32]. First, 200 µL of root extract (at concentration ranging from 0.05 to10 mg mL−1) was added to 4.5 mL of DPPH solution (0.004% in methanol). Then, the reaction mixture was mixed thoroughly and incubated at 25 °C for 40 min. Subsequently, the absorbance of the reaction mixture was recorded using a spectrophotometer (Jasco V530 UV-VIS spectrophotometer, Japan) at 517 nm. BHT was used as a positive control (standard antioxidant). Free radical scavenging activities were calculated with the following equation:
DPPH scavenging activity (IC50) = (Abscontrol − Abssample)/Abscontrol
where Abscontrol is the absorbance value of the reaction mixture without the root extract, and Abssample is the absorbance value of the reaction mixture with the root extract.

2.6.2. 2,2′-Azino-bis-3-Ethylbenzthiazoline-6-Sulphonic Acid (ABTS+) Assay

The ABTS radical scavenging activity assay was performed to determine the antioxidant properties of A. japonica root extracts following the method described previously [33]. Briefly, the ABTS solution was made by mixing 7.4 mM L−1 ABTS and 2.6 mM L−1 potassium persulphate in a 1:1 (v/v) ratio. Then, the reaction mixture was incubated at room temperature (25 °C) for 12 h. The mixture was then diluted with 80%methanol, and the absorbance of the solution was recorded at 734 nm using a spectrophotometer (Jasco V530 UV-VIS spectrophotometer, Japan). Trolox at various concentrations was used to construct the standard calibration curve. The ABTS radical scavenging results were expressed as micromoles of trolox equivalents (TE) per gram of dry weight (μmol TE g−1 DW). The ability to scavenge ABTS radicals was calculated with the following equation:
ABTS scavenging activity (IC50) = (Abscontrol − Abssample)/Abscontrol × 100
where Abscontrol is the absorbance of the ABTS solution without the plant sample, and Abssample is the absorbance of the ABTS solution with the plant sample. Inhibitory concentration (IC50) values indicate the amount of test sample needed to inhibit or scavenge 50% of the radicals present in the reaction mixture.

2.7. Sample Digestion

A. japonica root extracts were pre-digested in HNO3 by following the protocol described by the US Environmental Protection Agency, 2007. Briefly, 0.5 g of the ground root samples collected on two different months (October and November) were mixed with 7 mL of 70% HNO3 at room temperature (25 °C) for 6 h. Then, 1 mL of 35% H2O2 was added to the mixture; digestion was performed at 180 °C for 20 min until samples became colorless. The digested samples were diluted with 50 mL of ultrapure distilled water. Blanks were made with the same method described above, excluding the sample.

2.8. Instrumentation and Quantification of Minerals

The digested samples were subjected to inductively coupled plasma atomic emission spectroscopy (ICP-AES) (Optima 7300 DV, Perkin Elmer, Shelton, CT, USA) to quantify the mineral element content in the A. japonica root extracts. ICP-AES was operated under the following conditions: 0.2 L min−1 auxiliary; 1300 W RF powder; 15 L min−1 axial mode plasma, 0.65 L min−1 nebulizer; and 1.5 mL min−1 flow rate. The radial mode of the ICP-AES was used to quantify the mineral elements. The concentration ranges for the elemental standards are provided in Table 1. The limit of detection (LOD) and limit of quantitation (LOQ) for various elements were estimated with the following equations:
LOD = 3 × SD/S,
LOQ = 10 × SD/S,
where SD is the standard deviation of a response, and S is the slope of the calibration curve.

2.9. Assessment of Toxicity on Fibroblasts

The toxicity of A. japonica extracts was evaluated on NIH/3T3 fibroblasts according to the method previously described [34]. The cell line was provided by the School of Biomedical Science, Kangwon National University, South Korea. Briefly, the cells were grown in a 96-well microtitration plate at a density of 6 × 10³ per well with 100 mL of the medium. Cells were supplemented with 10 mL of culture medium composed of Dulbecco’s Modified Eagle’s Medium (DMEM) (Life Technologies, Carlsbad, CA, USA), 10% fetal bovine serum (v/v) (Life Technologies, USA), and 1% antibiotic (penicillin-streptomycin, Life Technologies, USA) (v/v), and inoculated in a humidified growth chamber (SANYO Electric cooperation, Osaka, Japan), with 5% CO2 at 37 °C (Ombredane, 2016) for 24 h. Then, the A. japonica root extracts were added to each well and transferred to the oven for 24 h. The supernatant was discarded, and the resultant formazan crystals were dissolved in DMSO (Sigma, USA). The absorbance value of each treated sample was assessed with a microplate reader (Thermofisher Scientific Instrument Co. Ltd., Shanghai, China) at 570 nm. Cell viability was determined with the following equation:
% cell viability = A570 of treated cells/A570 of control cells × 100.

2.10. Assessment of Irritation Potential of A. japonica Root Extracts in Fertile Chicken Egg

The antiallergic properties of A. japonica root extracts were assessed with the HET-CAM test. Fertile chicken eggs were purchased from a chicken farm. Then, they were incubated at 37 °C with 60% relative humidity and allowed for the development of embryos. On the ninth day, the incubated fertile chicken eggs were opened to expose the CAM. Subsequently, root extracts at a concentration of 1000 ppm in a volume of 0.4 mL were added to the CAM. The irritant effect of A. japonica root extracts on capillaries and albumin was immediately recorded and scored between 0 and 21 on each treated egg on the basis of coagulation, hemorrhage, and lysis for 300 s. The ocular irritation index (OII) was then obtained by the following equation:
OH = (301 − h) × 5/300 + (301 − 1) × 7/300 + (301 − c) × 9/300
where h represents the time to initiation of hemorrhage, l the time to lysis, and c the time to coagulation. The following classification was used: OII ≤ 0.9, slightly irritating; 0.9 < OII ≤ 4.9, moderately irritating; 4.9 < OII ≤ 8.9, irritating; and 8.9 < OII ≤ 21, severely irritating.

2.11. Statistical Analysis

All experiments were performed in triplicate. Statistical analysis was performed calculating the mean ± standard deviation using the one way analysis of variance (ANOVA). Significant differences between the parameters were determined with Tukey’s multiple comparison test at p < 0.05 and p < 0.01. Principal component analysis was used to examine the interrelationship between phenolic compounds, antioxidant activity, and minerals. Calibration curves were obtained by linear regression using Excel 2010. The interrelationship between minerals and phenolic compounds and antioxidant and cytotoxic properties were assessed by Pearson’s correlation coefficient using SPSS version 20 (SPSS, 2011).

3. Results

3.1. Total Phenolic and Flavonoid Contents

Total phenolic content (TPC) was quantified using the Folin–Ciocalteu method. The TPC averages in A. japonica root extracts differed between the two harvesting periods (Figure 1A). Samples harvested in October had significantly higher phenolic contents (8.001 ± 0.28 mgg−1) than those harvested in November (4.62 ± 0.18 mgg−1).
The total flavonoid content (TFC) of A. japonica root extracts collected at two different harvesting seasons were also significantly different. The TFC was 0.068 mgGAEg−1 and 0.035 mgQEg−1 in the October and November extracts, respectively (Figure 1B).

3.2. Phenolic Compound Contents

The seasonal fluctuation of phenolic compound accumulation in A. japonica roots is shown in Table 1. Ten phenolic and flavonoid compounds were detected and quantified in root samples (Figure 2A,B). The concentration of henolic compounds including Protocatechuic acid, Chlorogenic acid, p-Coumaric acid, Rutin, Salicylic acid, Caffeic acid, Orientin, Vitexin, Apigenin, Luteolin were varied significantly in the two harvest. The content of phenolics such as Protocatechuic acid (1166.70 ± 20.90 µgg−1 DW, Chlorogenic acid (133,833.30 ± 50.00 µgg−1 DW), Rutin (639.20 ± 10.00 µg/g DW), Salicylic acid(536.70 ± 12.00 µgg−1 DW), Caffeic acid (583.66 ± 15.00 µgg−1 DW), Orientin (585.80 ± 17.00 µgg−1 DW), Vitexin (591.70 ± 11.90 µgg−1 DW), Apigenin (1325.00 ± 20.00 µgg−1 DW) were significantly higher in the samples collected in October (Table 1). The samples harvested in November had a lower content of total phenolic compounds, with values ranging from 67.30 to 5298.90 µgg−1 DW. The phenolic compounds with increased concentrations when roots were harvested in November included p-coumaric acid (170.17 ± 26.52 µgg−1 DW), and Luteolin (949.30 ± 12.00 µgg−1 DW). Chlorogenic acid was the most abundant phenolic compound (133,833.30 µgg−1 DW and 5298.90 ± 38.82 µgg−1 DW, respectively) in both harvests. There was a considerable variation in the temperature, precipitation, and relative humidity between the two periods of sample harvesting (Figures S1 and S2).

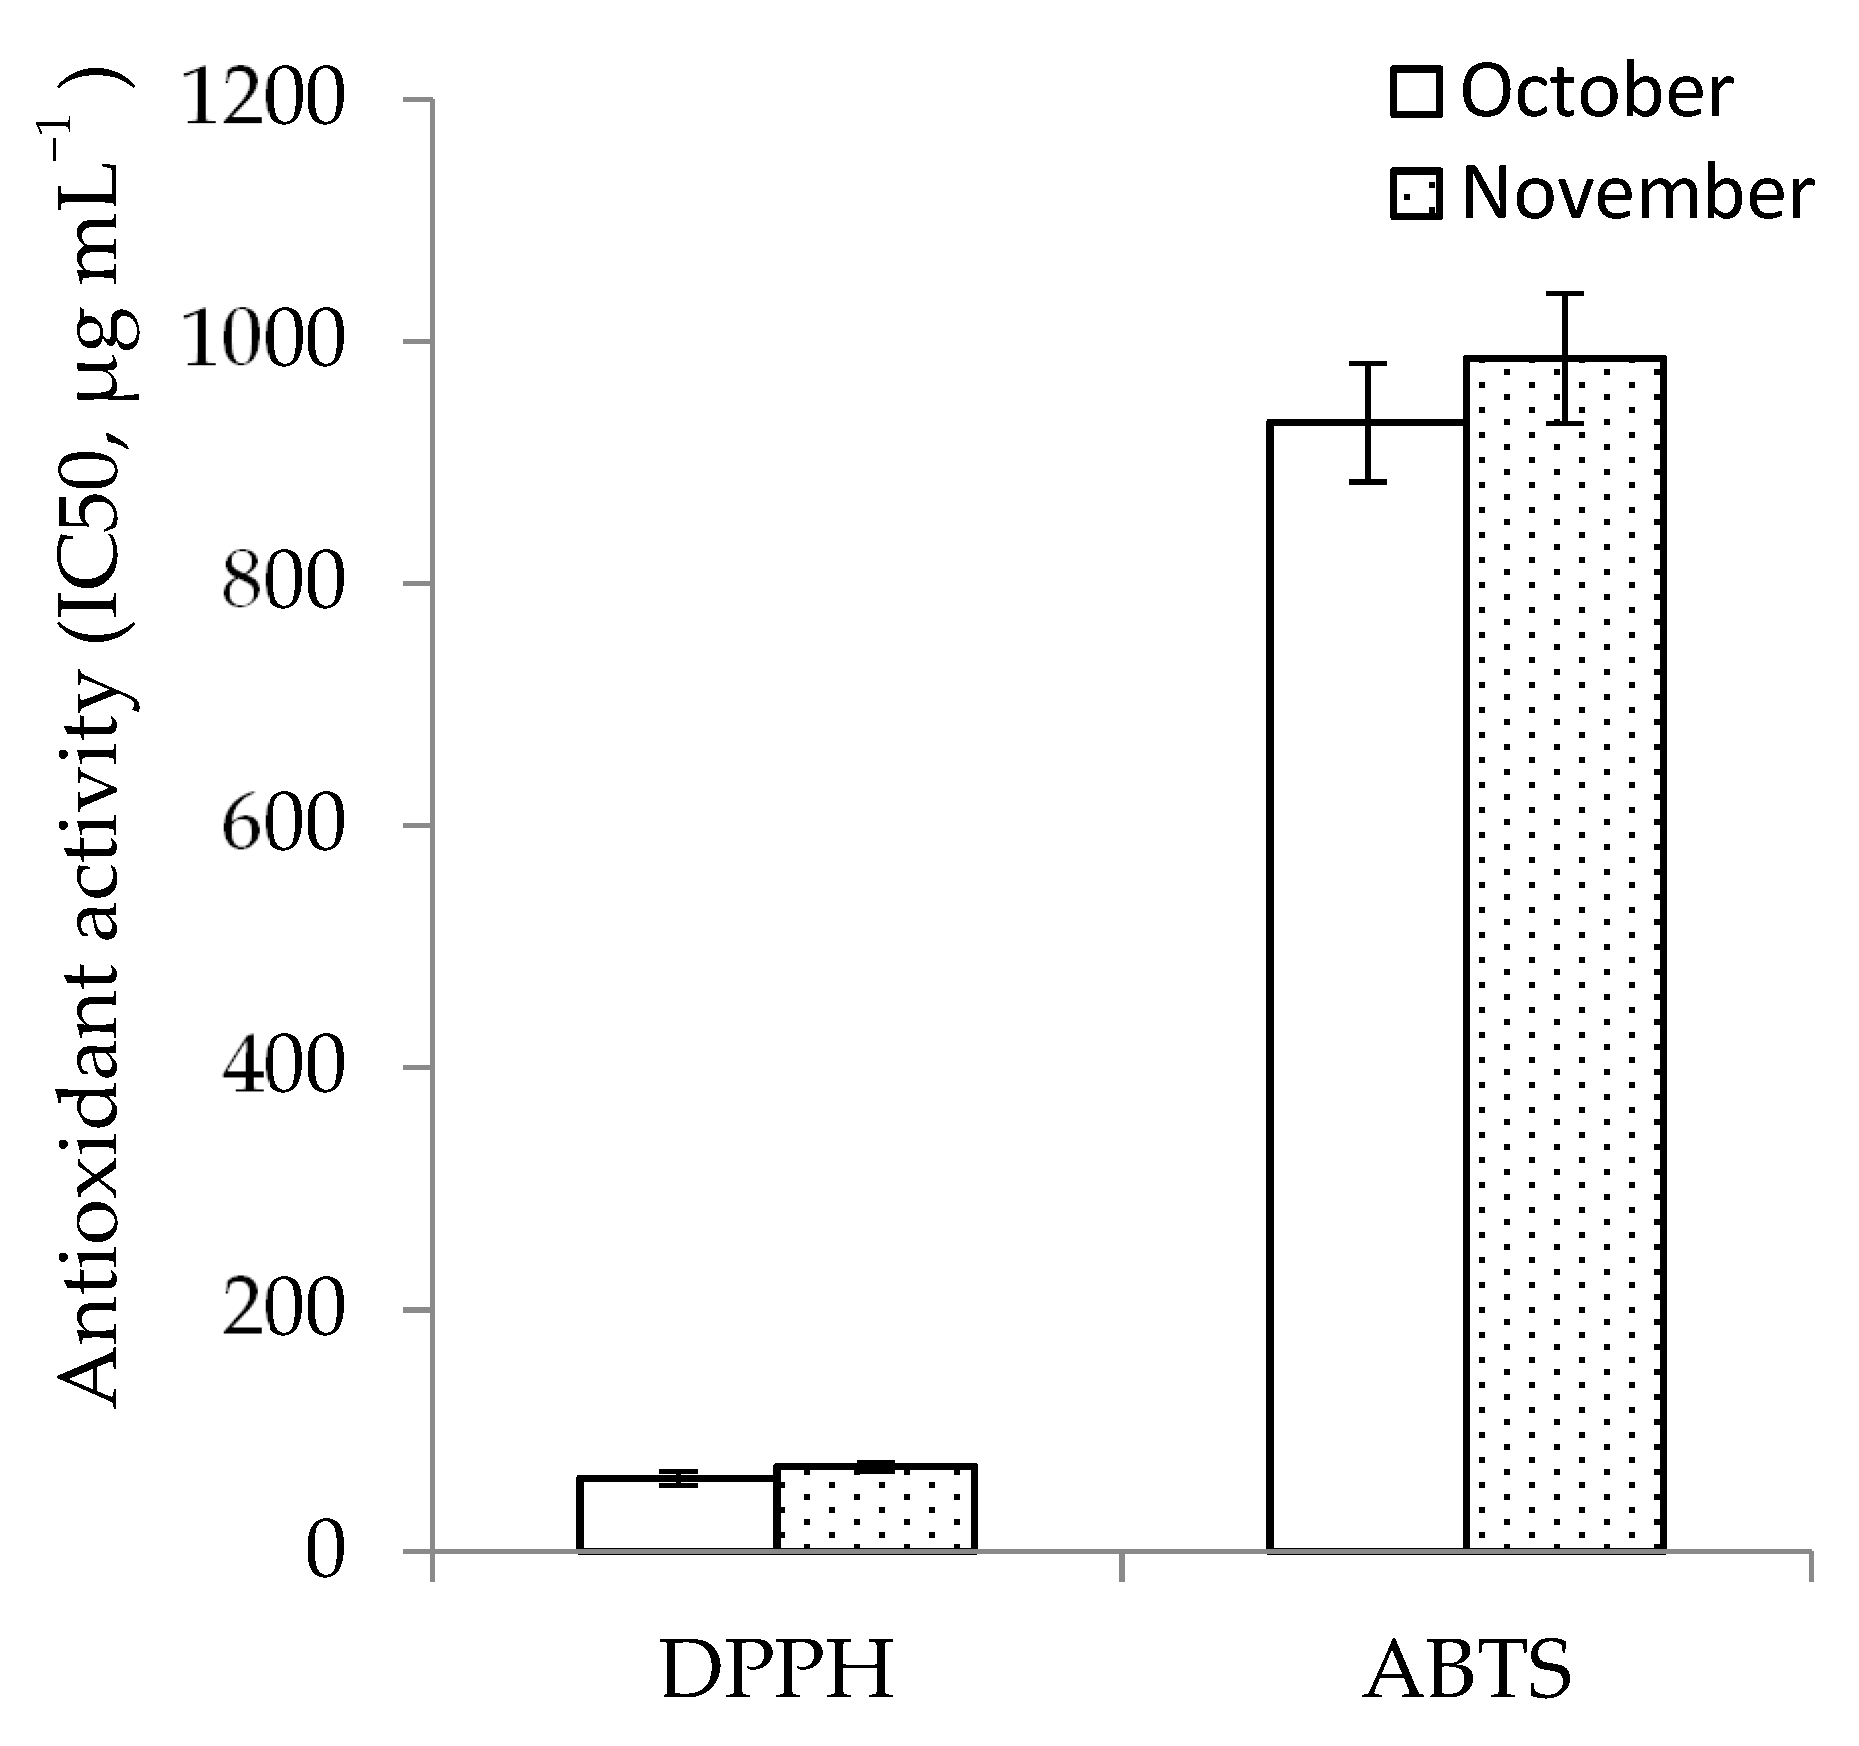
3.3. Antioxidant Activity

The antioxidant capacity of A. japonica samples collected in two different seasons was investigated using the 1,1-diphenyl–2-picrylhydrazyl (DPPH) and 2,2′-azino-bis-3-ethylbenzthiazoline-6-sulphonic acid (ABTS) assays (Figure 3). The inhibitory concentration (IC50) values were determined from plotted graphs and indicated the amount of test sample needed to inhibit or scavenge 50% of the radicals present in the reaction mixture. The IC50 value inversely correlates with the antioxidant potency of an organ (Figure 3). The DPPH antioxidant activity of root extracts increased in a concentration-dependent manner, reaching the maximum value of 60.64 ± 0.25 µg mL−1in roots harvested in October. For all concentrations tested, the antioxidant activity was significantly higher (p < 0.05) in samples collected in October than in those harvested in November (70.39 ± 0.35 µg mL−1).
The antioxidant activity measured using ABTS was significantly higher in October-collected root samples (932.71 ± 0.35 µg mL−1) than in those collected in November (985.69 ± 0.35 µg mL−1). The Pearson’s correlation between phenolic compound content and antioxidant potential (1/IC50) varied greatly among samples collected in different months (Table 1). The DPPH and ABTS assay conducted in the sample collected in the month of October had a higher positive correlation with Caffeic acid (r = 0. 817, p < 0.05; and r = 0.916, p < 0.05, respectively). Similarly, the DPPH and ABTS assay values showed a higher positive correlation with Orientin (r = 0.810, p < 0.05; and r = 0.910, p < 0.05, respectively). While, a moderate and significant positive correlation was observed between antioxidant activity with other phenolic compounds including protocatechuic acid, chlorogenic acid, p-coumaric acid, rutin and salicylic acid (Table 2). A moderate and significant positive correlation was observed between antioxidant activity in the sample collected in the month of November with phenolic compounds including protocatechuic acid, chlorogenic acid, p-coumaric acid, rutin and salicylic acid, indicating that these compounds may be associated with the A. japonica antioxidant potential.

3.4. Mineral Content

The results of the mineral composition analysis of A. japonica root extracts are shown in Table 3 and Table 4. Among the different minerals analyzed, macro-elements contents (Ca and Mg) was were significantly increased (92.770 ± 0.654 μg mL−1 and 28.680 ± 0.155 μg mL−1, respectively), with delaying harvesting time. The analysis revealed that micro-elements such as Mn, Fe, and Al were the most abundant in roots extracts. Among these, Cu and Fe, important components for chlorophyll synthesis in plants, were present in higher concentrations (0.057 ± 0.0004 μg mL−1 and 0.953 ± 0.0063 μg mL−1, respectively) in roots harvested in October. In this study, a seasonal fluctuation was observed in the concentration of micro-elements. Data revealed a higher accumulation of micro-elements such as AL, Cu, and Fe (0.701 ± 0.0073 μg mL−1, 0.057 ± 0.0004 μg mL−1, 0.953 ± 0.0063 μg mL−1, respectively) in the sample collected in October. The statistical analysis indicated that the micro-elements such as Mn, Zn, Cd and Ba content was influenced by the harvesting time, reaching higher values (1.696 ± 0.0032 μg mL−1, 0.303 ± 0.0047 μg mL−1, 0.090 ± 0.0019 μg mL−1, 0.269 ± 0.0035 μg mL−1, respectively) in the samples harvested in November. The analysis revealed higher accumulation of trace elements such as As, Bi, and Si in the October harvest. The concentration of trace elements such as Co, Ni, and Pb increased with delaying harvesting time. The Ti, Cr, Li and Ag concentrations had a similar accumulation patterns in the two harvests.

3.5. Cytotoxicity Activity

Cytotoxicity was determined with the 3-(4,5-dimethylthiazol-2-yl)-2,5- diphenyl tetrazolium bromide (MTT) assay using NIH/3T3 cells treated with the A. japonica 80% methanolic extracts or a positive control (Tamoxifen). As shown in Figure 4, there was a dose-dependent effect in the inhibition of NIH/3T3 cellular proliferation by the root extracts. We recorded the cytotoxicity of root extracts at various concentrations. As shown in Figure 4 and Figure 5, the viability of NH3/T3 cells was not significantly affected when the plant extract concentration was between 15.63 and 62.5 ppm, and high cellular viability was maintained. At the lower concentrations (less than 62.5 ppm), the root extracts led to more than 90% cell viability after 24 h of exposure. A slight reduction in cell viability was observed at 125 ppm, indicating that there was still a toxicity effect that should be considered before medicinal use. Moreover, we observed a strong positive correlation between cytotoxicity and p-coumaric acid (r = 0.974, p < 0.05), salicylic acid (0.908, p < 0.05), chlorogenic acid (r = 0.978, p < 0.05), caffeic acid (r = 0.959, p < 0.05), and Protocatechuic acid (r = 0.987, p < 0.01) contents (Table 5).

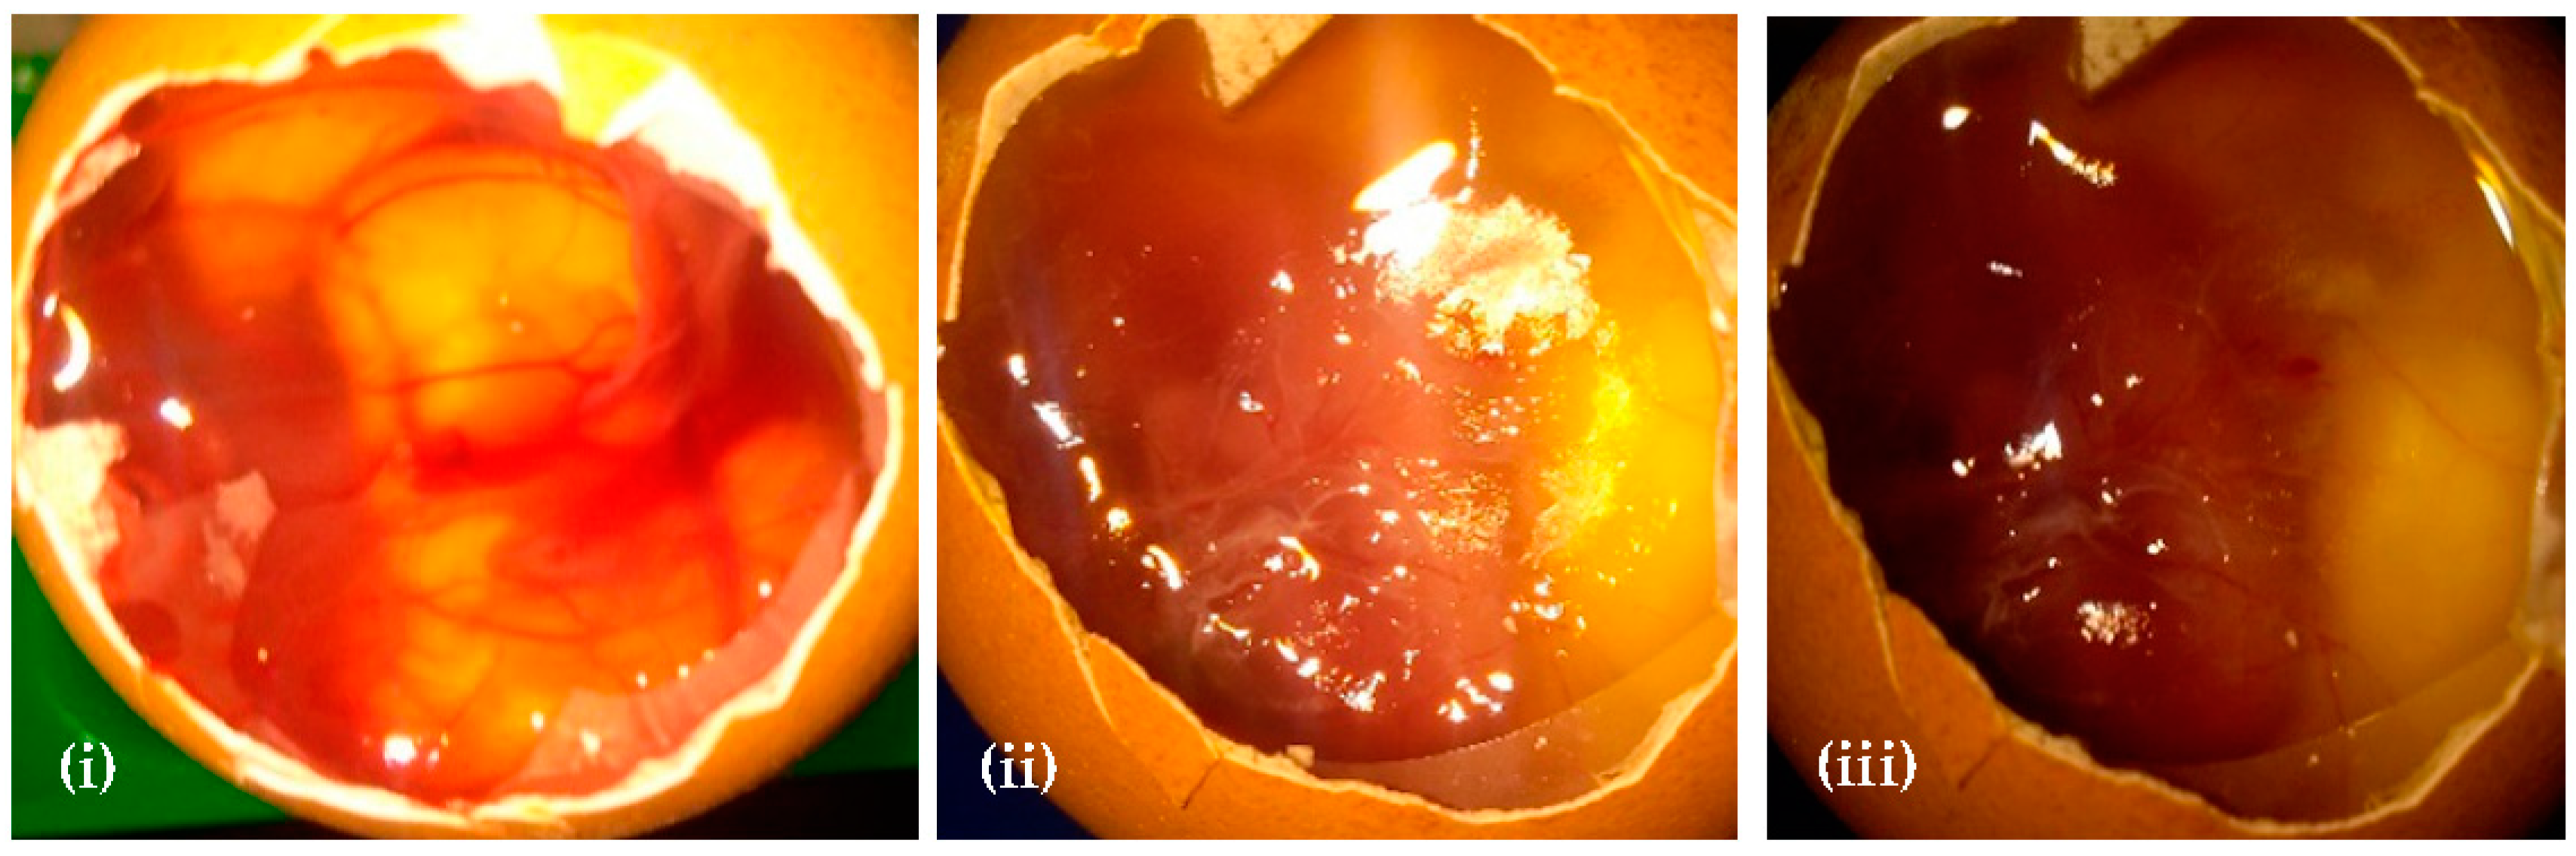
3.6. Assessment of Irritation Potential of Root extracts by the HET–CAM Assay

The Hen’s egg test–on the chorioallantoic membrane (HET–CAM) of chicken embryos is a reliable, rapid, and cost-effective approach to investigate the irritation potential of chemicals; it is routinely used in the cosmetic industry and in the development of cosmeceuticals. We tested the irritation potential of different root extract concentrations using different parameters (coagulation, hemorrhage, and lysis). The analyses showed that lower extract concentrations did not exhibit embryonic toxicity (Figure 6 and Table 6).

4. Discussion

This study was performed to assess the influence of harvesting time on the TPC, TFC, phenolic compound profile, mineral content, and cytotoxic effects of A. japonica root extracts harvested in October or November. The TPC and TFC were higher in samples harvested in October. Higher levels of total phenolics in samples harvested earlier were also observed in Vaccinium corymbosum [35] and Dioscorea cayenensis [36]. Similar results were also reported by [37]. Moreover, flavonoid biosynthesis is closely related to the plant development stage and is significantly affected by diverse ecological and developmental factors [38,39]. Other reports indicated that genotype, ontogenesis, analysis time, processing, environment, developmental stage, and storage conditions affect the plant phenolic compound contents [40,41]. Wide changes in the environmental conditions, including temperature, humidity, and precipitation, observed during A. japonica growth (Supplementary Figures S1 and S2). Flavonoids might be converted to other compounds–flavones, flavonols, flavanones, cell wall components, or oligo and polymeric compounds–with changes in the environment [42,43]. UV radiation also affects flavonoid biosynthesis [44,45,46,47]. Flavonoids decrease the photo-oxidative damage caused by UV absorption and inhibit ROS generation by inhibiting the enzymes involved in radical formation [48]. Therefore, the higher flavonoid accumulation in the October samples could derive from higher temperatures and irradiance. This change likely increased UV light absorption and reduced ROS generation in A. japonica plants. Previous studies reported increased flavonol contents in response to increased irradiance levels [49,50,51]. Similar results were obtained in Aloysia gratissima [52], Moringa oleifera [53], Fagus sylvatica [54], and Ginkgo biloba [55]. Moreover, a positive correlation between phenolic compound content and light availability has also been previously reported [51].
Phytochemicals have various biological activities, including biochemical and pharmacological properties and high antioxidant potential (e.g., polyphenols) [56]. Various studies have attributed the plant antioxidant potential to phenolic compounds, including protocatechuic acid, rutin, ferulic acid, naringenin, gentisic acid, and quercetin, which effectively act as reducing agents, hydrogen donors, and singlet oxygen quenchers [57]. We observed a strong correlation between TPC and DPPH and a moderate positive correlation between TPC and ABTS in A. japonica root extracts. There was also a positive significant correlation between antioxidant activity (DPPH assay) and the phenolic acids rutin, chlorogenic acid, and p-coumaric acid, indicating that these compounds are strongly associated with the A. japonica antioxidant potential. However, we did not observe a correlation between ABTS and phenolic compound contents. The differences between the two assays may derive from different responses of antioxidant and oxidant substances to different radicals. Our results showed significant differences in the antioxidant activity in samples with different harvesting times. The ferulic acid content was well correlated with the DPPH scavenging activity in A. japonica. Similarly, there was a strong positive correlation between the sum of the p-coumaric acid and gallic acid (GA) contents and the antioxidant activity of root extracts. Previous studies have also revealed a significant positive correlation between phenolic compounds and the antioxidant activity of leaf extracts [58,59]. Phenolic compounds act as antioxidants by neutralizing/scavenging free radicals produced during metabolic processes [56,57,58,59,60]. Chlorogenic acid and rutin have well-established antioxidant activity [61]. Our results corroborate the hypothesis that phenolic compounds contribute to the A. japonica antioxidant activity. Different phenolic compounds may interact and synergistically scavenge free radicals [62]. Therefore, these phytochemicals may be crucial to the plant’s antioxidant activity and highly influenced by the harvesting time.
A. japonica grown in October received longer daily light periods and higher temperatures than plants grown in November; they might have had higher protection against UV light through increased accumulation of phenolic compounds. Samples harvested in October had higher phenolic compound concentrations, including ferulic acid, rutin, quercetin, kaempferol, and apigenin, indicating a greater need for protection against photo-oxidative stress caused by higher irradiance. Flavonoids, including kaempferol and quercetin, protect plant tissues against UV radiation [48]. Additionally, plants enhance their phenolic content in response to the oxidative pressure caused by higher light intensity [63]. However, the correlation between the phytochemical content and environmental conditions, such as precipitation, temperature, and harvesting time, remains controversial [64]. Higher flavonoid contents were observed in Lippia alba leaves harvested during the summer. Conversely, the TPC increased in the bark of Secondatia floribunda harvested during the dry season [65]. Future work should explore the correlation between these parameters in more detail. Taken together, the results suggest that irradiance, precipitation, and temperature influenced phenolic compound accumulation in A. japonica. Therefore, the harvesting period of A. japonica roots should be carefully selected when considering the intended plant applications. Overall, higher temperature and solar radiation intensity are the main factors that promote phenolic compound biosynthesis.
Harvesting time had a significant influence on the concentration of minerals in A. japonica root samples. Early harvesting (October) decreased Mg and Ca concentrations. The difference in the mineral content between the two harvesting times may result from differences in the mineral quantities absorbed from the soil. Mg is a very mobile element in the phloem [66] and actively associated with the in the processes of respiration, DNA and RNA synthesis, and involved in chlorophyll structure. Apart from this, magnesium plays an important role in photosynthesis by activating the enzymes related to carbohydrate metabolism [67]. Higher Mg contents observed in the October root samplings may be related to the rapid mobility of Mg and occurrence of greater demand of Mg being related to higher carbohydrate metabolism due to rapid growth, flowering and green fruit production of A. japonica. In addition to the association with the mechanical strength of tissues, calcium is important pollen germination and pollen tube growth during flowering period [68]. A notable increase of the calcium in the October sample could be due to increase its demand in the foliar region and higher mobility of calcium from root for potential use in the flowering and in the maturity of the fruit. Moreover, Moreno and Garcra-Creus [69] observed reduction in the Ca content via transpiration stream in Olive tree during hot (higher temperature) and dry period, which also corroborates with present study. Depletion in the supply of Mg and Ca to the foliar region in the cold month of November could result in its higher accumulation in the A. japonica root. According to [70], this variation may be due to changes in the ecological conditions at different harvesting times. Fe is an important enzymatic constituent that plays significant roles in respiration, photosynthesis, and DNA synthesis [71]. Its concentration was higher in samples harvested in October, which could be explained by the higher photosynthesis and respiration rates caused by higher temperatures. Our study also corroborated the results obtained in Lablab lines [72] and in Phalaris arundinacea [73], in which the content of various minerals increased with early harvesting. Zn and Mn plant components that are critical for secondary metabolite synthesis, therefore influencing antioxidant activity and ROS scavenging in cells [22]. Mn cations influence phenylalanine ammonia-lyase (PAL) function; PAL is one of the key enzymes responsible for phenol biosynthesis [74]. We observed an increase in Mn, and Zn concentrations in the October harvest. These minerals could be associated with the antioxidant properties of A. japonica, as revealed by a positive correlation between those factors (Table S1). Hence, mineral availability changes with the season, as well as with the plant developmental stage.
The MTT assay is a rapid and reliable colorimetric method to assess cell viability and death [75]. A. japonica root extracts of collected in October exhibited cytotoxicity in a concentration-dependent manner. Cell viability was not significantly affected at low extract concentrations. Unnecessarily high bioactive compound concentrations may disrupt their function and cause cell death. Various studies attributed the cytotoxicity of plant extracts to the presence of specific phytochemicals [76,77,78,79]. For example, higher rutin, chlorogenic acid, and luteolin concentrations significantly reduced the growth of NIH/3T3 cells. Similarly, there was a strong positive correlation between cytotoxicity and the concentration of protocatechuic acid, chlorogenic acid, p-coumaric acid, salicylic acid, quercetin, luteolin, and quercetin derivatives [80,81,82,83]. Here, we observed a strong positive correlation between cytotoxicity and p-coumaric acid, salicylic acid, chlorogenic acid, salicylic acid, and rutin contents, suggesting that the higher concentration of these compounds is associated with the cytotoxicity effect of A. japonica. The root extracts of this plant contain diverse essential phytochemical and exhibits wide range of biological properties, but the potential toxic effects of the extract still remain unclear. Therefore, in this study, we performed HET-CAM assay, which is was a widely used to identify substances that can consider as irritant or non-irritant natural substances [84]. Our result indicate that a lower concertation of A. japonica roots extracts has no toxic effects.

5. Conclusions

In this study, different harvest times directly influenced the phenolic composition of A. japonica plants. Hence, we inferred that the seasonal variation in the composition and concentration in phenolic compounds and minerals in A. japonica plants resulted from changes in environmental factors, including temperature, humidity, precipitation, and harvesting time. The concentration of various phenolic compounds, including protocatechuic acid, chlorogenic acid, rutin, salicylic acid, caffeic acid, orientin, vitexin, and apigenin, was significantly changed between harvesting seasons, which directly influenced the plant antioxidant activity. This study further elucidated that A. japonica harvesting time is essential for obtaining desired chemical constituents for specific applications.

Supplementary Materials

The following are available online at https://www.mdpi.com/article/10.3390/agronomy11071327/s1, Figure S1. Fluctuation in the (A) humidity, (B) precipitation in the month of October and November during growth of A. japonica. Figure S2. Fluctuation in the temperature in the month of October and November during growth of A. japonica. Table S1. Pearson’s correlation coefficients of the antioxidant properties and minerals. Table S2. Calibration curves of 16 phenolic compounds.

Author Contributions

B.K.G. contributed by doing the experiment and writing of the manuscript; C.-Y.Y. supervised the experiment; J.-W.S. and B.G. contributed by doing the experiment on cytotoxicity effects; J.-G.L., I.-M.C. and S.-H.K. contributed by analyzing phenolic compounds and editing the revised manuscript. All authors have read and agreed to the published version of the manuscript.

Funding

This work was supported by a BrainKorea21 plus (BK21+, grant no. 22A20153813519, team: Omics Research of Crop Bioresources for Future, Konkuk University), the National Research Foundation of Korea, Republic of Korea.

Acknowledgments

This work was supported by funding from the KU research professor program.

Conflicts of Interest

The authors declare no conflict of interest.

References

  1. Kim, C.M.; Shin, M.K.; Ahn, D.G.; Lee, K.S. Chungyak Daesajun; Jungdam Publisher: Seoul, Korea, 1997; Volume 8, pp. 3969–3976. [Google Scholar]
  2. Kwak, J.S.; Seong, H.G.; Chang, K.J. Medicinal Plant Cultivation; Blue Happy Press: Seoul, Korea, 2011; pp. 1–423. [Google Scholar]
  3. Park, J.H.; Seong, S.H. Medicinal Plant; Shinilbooks: Seoul, Korea, 2007; pp. 1–568. [Google Scholar]
  4. Satoh, K.; Nagai, F.; Ushiyama, K.; Kano, I. Specific inhibition of Na+, K(+)-ATPase activity by atractylon, a major component of byaku-jutsu, by interaction with enzyme in the E2 state. Biochem. Pharmacol. 1996, 51, 339–343. [Google Scholar] [CrossRef]
  5. Jang, M.H.; Shin, M.C.; Kim, Y.J.; Kim, C.J.; Kim, Y.H.; Kim, E.H. Atractylodes japonica suppresses lipopolysaccharide-stimulated expression of inducible nitric oxide synthase and cyclooxygenase-2 in RAW 264.7 macrophages. Biol. Pharm. Bull. 2004, 27, 324–327. [Google Scholar] [CrossRef] [PubMed] [Green Version]
  6. Hong, M.H.; Kim, J.-H.; Bae, H.; Lee, N.-Y.; Shin, Y.-C.; Kim, S.-H.; Ko, S.-G. Atractylodes japonica Koidzumi inhibits the production of pro-inflammatory cytokines through inhibition of the NF-κB/IκB signal pathway in HMC-1 human mast cells. Arch. Pharm. Res. 2020, 33, 843–851. [Google Scholar] [CrossRef]
  7. Jeong, S.I.; Kim, S.Y.; Kim, S.J.; Hwang, B.S.; Kwon, T.H.; Yu, K.Y.; Hang, S.H.; Suzuki, K.; Kim, K.J. Antibacterial activity of phytochemicals isolated from Atractylodes japonica against methicillin-resistant Staphylococcus aureus. Molecules 2010, 15, 7395–7402. [Google Scholar] [CrossRef] [PubMed] [Green Version]
  8. Min, B.S.; Kim, Y.H.; Tomiyama, M.; Nakamura, N.; Miyashiro, H.; Otake, T.; Hattori, M. Inhibitory effects of Korean plants on HIV-1 activities. Phytother. Res. 2001, 15, 481–486. [Google Scholar] [CrossRef] [PubMed]
  9. Sakurai, T.; Sugawara, H.; Saito, K.; Kano, Y. Effects of the acetylene compound from Atractylodes rhizome on experimental gastric ulcers induced by active oxygen species. Biol. Pharm. Bull. 1994, 17, 1364–1368. [Google Scholar] [CrossRef] [Green Version]
  10. Choi, K.H.; Jeong, S.I.; Lee, J.H.; Hwang, B.S.; Kim, S.J.; Lee, S.; Choi, B.K.; Jung, K.Y. Pharmacological mechanism responsible for the Atractylodes japonica-induced distal colonic contraction in rats. Phytomedicine 2011, 18, 408–413. [Google Scholar] [CrossRef] [PubMed]
  11. Yu, K.W.; Kiyohara, H.; Matsumoto, T.; Yang, H.C.; Yamada, H. Intestinal immune system modulating polysaccharides from rhizomes of Atractylodes lancea. Planta Med. 1998, 64, 714–719. [Google Scholar] [CrossRef] [Green Version]
  12. Chen, L.G.; Jan, Y.S.; Tsai, P.W.; Norimoto, H.; Michihara, S.; Murayama, C.; Wang, C.C. Anti-inflammatory and antinociceptive constituents of Atractylodes japonica koidzumi. J. Agric. Food Chem. 2016, 64, 2254–2262. [Google Scholar] [CrossRef]
  13. Kitajima, J.; Kamoshita, A.; Ishikawa, T.; Takano, A.; Fukuda, T.; Isoda, S.; Ida, Y. Glycosides of Atractylodes japonica. Chem. Pharm. Bull. 2003, 51, 152–157. [Google Scholar] [CrossRef] [PubMed] [Green Version]
  14. Wang, C.C.; Lin, S.Y.; Cheng, H.C.; Hou, W.C. Pro-oxidant and cytotoxic activities of atractylenolide I in human promyeloleukemic HL-60 cells. Food Chem. Toxicol. 2006, 44, 1308–1315. [Google Scholar] [CrossRef] [PubMed]
  15. Choi, K.H.; Jeong, S.I.; Lee, J.H.; Hwang, B.S.; Lee, S.; Choi, B.K.; Jung, K.Y. Acetylene compound isolated from Atractylodes japonica stimulates the contractility of rat distal colon via inhibiting the nitrergic-purinergic relaxation. J. Ethnopharmacol. 2011, 134, 104–110. [Google Scholar] [CrossRef] [PubMed]
  16. Karakaya, S. Bioavailability of phenolic compounds. Critical Rev. Food Sci. Nutr. 2004, 44, 453–464. [Google Scholar] [CrossRef]
  17. Ninfali, P.; Mea, G.; Giorgini, S.; Rocchi, M.; Bacchiocca, M. Antioxidant capacity of vegetables, spices and dressings relevant to nutrition. Br. J. Nutr. 2005, 93, 257–266. [Google Scholar] [CrossRef] [PubMed] [Green Version]
  18. Haslam, E. Natural polyphenols (vegetable tannins) as drugs: Possible modes of action. J. Nat. Prod. 1996, 59, 205. [Google Scholar] [CrossRef]
  19. Soares, S.E. Phenolic acids as antioxidants. Rev. Nutr. 2002, 15, 71–81. [Google Scholar] [CrossRef] [Green Version]
  20. Marschner, H. Mineral Nutrition of Higher Plants, 2nd ed.; Academic Press: Cambridge, MA, USA, 1995. [Google Scholar]
  21. Szymczycha-Madeja, A.; Welna, M.; Pohl, P. Elemental analysis of teas and their infusions by spectrometric methods. Trends Anal. Chem. 2012, 35, 165–181. [Google Scholar] [CrossRef]
  22. Valmorbida, J.; Boaro, C.S.F.; Scavroni, J.; David, E.F.S. Crescimento de Mentha piperita L. cultivada em solução nutritiva com diferentes doses de potássio. Revista Brasileira de Plantas Medicinais 2007, 9, 27–31. [Google Scholar]
  23. Treutter, D. Biosynthesis of phenolic compounds and its regulation in apple. Plant Growth Regul. 2001, 34, 71–89. [Google Scholar] [CrossRef]
  24. Dong, T.T.; Cui, X.M.; Song, Z.H.; Zhao, K.J.; Ji, Z.N.; Lo, C.K.; Tsim, K.W. Chemical assessment of roots of Panax notoginseng in China: Regional and seasonal variations in its active constituents. J. Agric. Food Chem. 2003, 51, 4617–4623. [Google Scholar] [CrossRef]
  25. Pęksa, A.; Golubowska, G.; Rytel, E.; Lisińska, G.; Aniolowski, K. Influence of harvest date on glycoalkaloid content of three potato varieties. Food Chem. 2002, 87, 313–317. [Google Scholar] [CrossRef]
  26. Lemos, M.F.; Lemos, M.F.; Pacheco, H.P.; Guimarães, A.C.; Fronza, M.; Endringer, D.C.; Scherer, R. Seasonal variation affects the composition and antibacterial and antioxidant activities of Thymus vulgaris. Ind. Crops Prod. 2017, 95, 543–548. [Google Scholar] [CrossRef]
  27. Sartor, T.; Xavier, V.B.; Falcão, M.A.; Mondin, C.A.; Santos, M.A.; Cassel, E.; Santarém, E.R. Seasonal changes in phenolic compounds and in the biological activities of Baccharis dentata (Vell.) GM Barroso. Ind. Crops Prod. 2013, 51, 355–359. [Google Scholar] [CrossRef]
  28. Yao, X.H.; Zhang, Z.B.; Song, P.; Hao, J.Y.; Zhang, D.Y.; Zhang, Y.F. Different harvest seasons modify bioactive compounds and antioxidant activities of Pyrola incarnata. Ind. Crops Prod. 2016, 94, 405–412. [Google Scholar] [CrossRef]
  29. Singleton, V.L.; Rossi, J.A., Jr. Colorimetry of total phenolics with phosphomolybdic-phosphotungstic acid reagents. Am. J. Enol. Vitic. 1965, 16, 144–158. [Google Scholar]
  30. Moreno, M.I.N.; Isla, M.I.; Sampietro, A.R.; Vattuone, M.A. Comparison of the free radical-scavenging activity of propolis from several regions of Argentina. J. Ethnopharmacol. 2000, 71, 109–114. [Google Scholar] [CrossRef]
  31. Chung, I.M.; Chelliah, R.; Oh, D.H.; Kim, S.H.; Yu, C.Y.; Ghimire, B.K. Tupistra nutans wall. root extract, rich in phenolics, inhibits microbial growth and α-glucosidase activity, while demonstrating strong antioxidant potential. Braz. J. Bot. 2019, 42, 383–397. [Google Scholar] [CrossRef]
  32. Xing, Q.; Kadota, S.; Tadata, T.; Namba, T. Antioxidative effect of phenylethanoids from Cistanche deserticola. Biol. Pharm. Bull. 1996, 19, 1580–1585. [Google Scholar] [CrossRef] [Green Version]
  33. Thaipong, K.; Boonprakob, U.; Crosby, K.; Cisneros-Zevallos, L.; Hawkins Byrne, D. Comparison of ABTS, DPPH, FRAP, and ORAC assays for estimating antioxidant activity from guava fruit extracts. J. Food Compos. Anal. 2006, 19, 669–675. [Google Scholar] [CrossRef]
  34. Sandra, F.; Sudiono, J.; Trisfilha, P.; Pratiwi, D. Cytotoxicity of Alpinia galanga rhizome crude extract on NIH-3T3 cells. Indones. Biomed. J. 2017, 9, 23–28. [Google Scholar] [CrossRef] [Green Version]
  35. Routray, W.; Orsat, V. Variation of phenolic profile and antioxidant activity of North American highbush blueberry leaves with variation of time of harvest and cultivar. Ind. Crop Prod. 2014, 62, 147–155. [Google Scholar] [CrossRef]
  36. Salawu, S.O.; Bester, M.J.; Duodu, K.G. Phenolic composition and bioactive properties of cell wall preparations and whole grains of selected cereals and legumes. J. Food Biochem. 2014, 38, 62–72. [Google Scholar] [CrossRef] [Green Version]
  37. Remorini, D.; Tavarini, S.; Degl, E.; Loreti, F.; Massai, R.; Guidi, L. Effect of rootstocks and harvesting time on the nutritional quality of peel and flesh of peach fruits. Food Chem. 2008, 110, 361–367. [Google Scholar] [CrossRef]
  38. Jaakola, L.; Määttä, K.; Pirttilä, A.M.; Torronen, R.; Karenlampi, S.; Hohtola, A. Expression of genes involved in anthocyanin biosynthesis in relation to anthocyanin, proanthocyanidin, and flavonol levels during bilberry fruit development. Plant Phys. 2002, 130, 729–739. [Google Scholar] [CrossRef] [Green Version]
  39. Francini, A.; Sebastiani, L. Phenolic compounds in apple (Malus domestica Borkh.): Compounds characterization and stability during postharvest and after processing. Antioxidants 2013, 2, 181–193. [Google Scholar] [CrossRef] [PubMed] [Green Version]
  40. Krüger, E.; Dietrich, H.; Hey, M.; Patz, C.D. Effects of cultivar, yield, berry weight, temperature and ripening stage on bioactive compounds of black currants. J. App. Bot. Food Qual. 2011, 84, 40–46. [Google Scholar]
  41. Martz, F.; Jaakola, L.; Julkunen-Tiitto, R.; Stark, S. Phenolic composition and antioxidant capacity of bilberry (Vaccinium myrtillus) leaves in Northern Europe following foliar development and along environmental gradients. J. Chem. Ecol. 2010, 36, 1017–1028. [Google Scholar] [CrossRef] [PubMed]
  42. Nurmi, K.; Ossipov, V.; Haukioja, E.; Pihlaja, K. Variation of total phenolic content and individual low molecular weight phenolics in foliage of mountain birch trees (Betula pubescens spp. tortuosa). J. Chem. Ecol. 1996, 22, 2023–2040. [Google Scholar] [CrossRef] [PubMed]
  43. Samanta, A.; Das, G.; Das, S.K. Roles of flavonoids in plants. Int. J. Pharm. Sci. Technol. 2011, 6, 12–35. [Google Scholar]
  44. Agati, G.; Tattini, M. Multiple functional roles of flavonoids in photoprotection. New Phytol. 2010, 186, 786–793. [Google Scholar] [CrossRef] [PubMed]
  45. Harborne, J.B.; Williams, C.A. Advances in flavonoid research since 1992. Phytochemistry 2000, 55, 481–504. [Google Scholar] [CrossRef]
  46. Tattini, M.; Galardi, C.; Pinelli, P.; Massai, R.; Remorini, D.; Agati, G. Differential accumulation of flavonoids and hydroxycinnamates in leaves of Ligustrum vulgare under excess light and drought stress. New Phytol. 2004, 163, 547–561. [Google Scholar] [CrossRef] [PubMed]
  47. Zhang, X.R.; Chen, Y.H.; Guo, Q.S.; Wang, W.M.; Liu, L.; Fan, J.; Cao, L.P.; Li, C. Short-term UV-B radiation effects on morphology, physiological traits and accumulation of bioactive compounds in Prunella vulgaris L. J. Plant Interact. 2017, 12, 348–354. [Google Scholar] [CrossRef]
  48. Mierziak, J.; Kostyn, K.; Kulma, A. Flavonoids as important molecules of plant interactions with the environment. Molecules 2014, 19, 16240–16265. [Google Scholar] [CrossRef] [PubMed]
  49. Brandt, K.; Giannini, A.; Lercari, B. Photomorphogenic responses to UV radiation III: A comparative study of UVB effects on anthocyanin and flavonoid accumulation in wild type and aurea mutant of tomato (Lycopersicon esculentum Mill.). Photochem. Photobiol. 1995, 62, 1081–1087. [Google Scholar] [CrossRef]
  50. Wu, S.; Li, J.; Wang, Q.; Cao, H.; Cao, J.; Xiao, J. Seasonal dynamics of the phytochemical constituents and bioactivities of extracts from Stenoloma chusanum (L.) Ching. Food Chem. Toxicol. 2017, 108, 458–466. [Google Scholar] [CrossRef]
  51. Armaleo, D.; Zhang, Y.; Cheung, S. Light might regulate divergently depside and depsidone accumulation in the lichen Parmotrema hypotropum by affecting thallus temperature and water potential. Mycologia 2008, 100, 565–576. [Google Scholar] [CrossRef] [Green Version]
  52. Zeni, A.L.B.; Albuquerque, C.A.C.D.; Gonçalves, F.; Latini, A.; Tasca, C.I.; Podestá, R.; Pagliosa, C.M.; Duarte, F.S.; Lima, T.; Maraschin, M. Phytochemical profile, toxicity and antioxidant activity of Aloysia gratissima (Verbenaceae). Quimica Nova 2013, 36, 69–73. [Google Scholar] [CrossRef] [Green Version]
  53. Iqbal, S.; Bhanger, M.I. Effect of season and production location on antioxidant activity of Moringa oleifera leaves grown in Pakistan. J. Food Compos. Anal. 2006, 19, 544–551. [Google Scholar] [CrossRef]
  54. Pirvu, L.; Grigore, A.; Bubueanu, C.; Draghici, E. Comparative analytical and antioxidant activity studies on a series of Fagus sylvatica L. leaves extracts. J. Planar Chromatogr. Mod. TLC 2013, 26, 237–242. [Google Scholar] [CrossRef]
  55. Sati, P.; Pandey, A.; Rawat, S.; Rani, A. Phytochemicals and antioxidants in leaf extracts of Ginkgo biloba with reference to location, seasonal variation and solvent system. J. Pharm. Res. 2013, 7, 804–809. [Google Scholar] [CrossRef]
  56. Oboh, G.; Rocha, J.B.T. Polyphenols in red pepper [Capsicum annuum var. aviculare (Tepin)] and their protective effect on some pro-oxidants induced lipid peroxidation in brain and liver. Eur. Food Res. Technol. 2006, 225, 239–247. [Google Scholar] [CrossRef]
  57. Nishimura, F.C.; de Almeida, A.C.; Ratti, B.A.; Ueda-Nakamura, T.; Nakamura, C.V.; Ximenes, V.F.; Silva, S.O. Antioxidant effects of quercetin and naringenin are associated with impaired neutrophil microbicidal activity. Evid. Based Complement. Alternat. Med. 2013, 2013, 795916. [Google Scholar] [CrossRef]
  58. Abidille, M.D.H.; Singh, R.P.; Jayaprakashna, G.K.; Jena, B.S. Antioxidant activity of the extracts from Dillenia indica fruits. Food Chem. 2005, 90, 891–896. [Google Scholar] [CrossRef]
  59. Kur, C.; Kapoor, H.C. Anti-oxidant activity and total phenolic content of some Asian vegetables. Int. J. Food Sci. Technol. 2002, 37, 153–161. [Google Scholar] [CrossRef]
  60. Melo, E.A.; Lima, V.L.A.; Maciel, M.I.S.; Caetano, A.C.S.; Leal, F.L.L. Polyphenol, ascorbic acid and total carotenoid contents in common fruits and vegetables. Braz. J. Food Technol. 2006, 9, 89–94. [Google Scholar]
  61. Sato, Y.; Itagaki, S.; Kurokawa, T.; Ogura, J.; Kobayashi, M.; Hirano, T.; Sugawara, M.; Iseki, K. In vitro and in vivo antioxidant properties of chlorogenic acid and caffeic acid. Int. J. Pharm. 2011, 403, 136–138. [Google Scholar] [CrossRef]
  62. Hidalgo, M.; Sánchez-Moreno, C.; Pascual-Teresa, S. Flavonoid–flavonoid interaction and its effect on their antioxidant activity. Food Chem. 2010, 121, 691–696. [Google Scholar] [CrossRef]
  63. Close, D.C.; McArthur, C. Rethinking the role of many plant phenolics—Protection from photodamage, not herbivores? Oikos 2002, 99, 166–172. [Google Scholar] [CrossRef]
  64. Gobbo-neto, L.; Lopes, N.P. Plantas medicinais: Fatores de influência no conteúdo de metabólitos secundários. Quimica Nova 2007, 30, 374–381. [Google Scholar] [CrossRef]
  65. Gomes, A.F.; Almeida, M.P.; Leite, M.F.; Schwaiger, S.; Stuppner, H.; Halabalaki, M.; Amaral, J.G.; David, J.M. Seasonal variation in the chemical composition of two chemotypes of Lippia alba. Food Chem. 2019, 273, 186–193. [Google Scholar] [CrossRef]
  66. Askin, M.A.; Balta, M.F.; Tekintas, F.E.; Kazankaya, A.; Balta, F. Fatty acid composition affected by kernel weight in almond [Prunus dulcis (Mill.) D.A. Webb] genetic resources. J. Food Compos. Anal. 2007, 20, 7–12. [Google Scholar] [CrossRef]
  67. Rout, G.R.; Sahoo, S. Role of iron in plant growth and metabolism. Rev. Agric. Sci. 2015, 3, 1–24. [Google Scholar] [CrossRef] [Green Version]
  68. Marschner, P. Mineral Nutrition of Higher Plants, 3rd ed.; Academic Press: London, UK, 2012; Volume 651. [Google Scholar]
  69. Camargo, P.N.; Silva, O. Manual de Adubação Foliar; Herba: Sao Paulo, Brazil, 1975; Volume 258. [Google Scholar]
  70. Epstein, E. Nutrição Mineral das Plantas: Princípios e Perspectivas; EDUSP: Sao Paulo, Brazil, 1975; Volume 344. [Google Scholar]
  71. Stateras, D.C.; Moustakas, N.K. Seasonal changes of macro- and micro-nutrients concentration in olive leaves. J. Plant Nutr. 2018, 4, 186–196. [Google Scholar] [CrossRef]
  72. Baloyi1, B.M.; Ayodele, V.I.; Addo-Bediako, A. Effects of leaf harvest on crude protein and mineral contents of selected early maturing lines of lablab (Lablab purpureus). Afr. J. Agric. Res. 2013, 8, 449–453. [Google Scholar]
  73. Christian, D.G.; Yates, N.E.; Riche, A.B. The effect of harvest date on the yield and mineral content of Phalaris arundinacea L. (reed canary grass) genotypes screened for their potential as energy crops in southern England. J. Sci Food Agric. 2006, 86, 1181–1188. [Google Scholar] [CrossRef]
  74. Yanai, N.; Shiotani, S.; Hagiwara, S.; Nabetani, H.; Nakajima, M. Antioxidant combination inhibits reactive oxygen species mediated damage. Biosci. Biotechnol. Biochem. 2008, 72, 3100–3106. [Google Scholar] [CrossRef] [Green Version]
  75. Li, F.; Li, S.; Li, H.B.; Deng, G.F.; Ling, W.H.; Xu, X.R. Antiproliferative activities of tea and herbal infusions. Food Funct. 2013, 4, 530–538. [Google Scholar] [CrossRef]
  76. Estevinho, L.; Pereira, A.P.; Moreira, L.; Dias, L.G.; Pereira, E. Antioxidant and antimicrobial effects of phenolic compounds extracts of northeast Portugal honey. Food Chem. Toxicol. 2008, 46, 3774–3779. [Google Scholar] [CrossRef]
  77. Aleksic, V.; Knezevic, P. Antimicrobial and antioxidative activity of extracts and essential oils of Myrtus communis L. Microbiol. Res. 2014, 169, 240–254. [Google Scholar] [CrossRef]
  78. Llorent-Martínez, E.J.; Ortega-Barrales, P.; Zengin, G.; Mocan, A.; Simirgiotis, M.J.; Ceylan, R.; Uysal, S.; Aktumsek, A. Evaluation of antioxidant potential, enzyme inhibition activity and phenolic profile of Lathyrus cicera and Lathyrus digitatus: Potential sources of bioactive compounds for the food industry. Food Chem. Toxicol. 2017, 107, 609–619. [Google Scholar] [CrossRef] [PubMed]
  79. Palchaudhuri, R.; Hergenrother, P.J. DNA as a target for anticancer compounds: Methods to determine the mode of binding and the mechanism of action. Curr. Opin. Biotechnol. 2007, 18, 497–503. [Google Scholar] [CrossRef]
  80. Thiruvengadam, M.; Ghimire, B.K.; Kim, S.H.; Yu, C.Y.; Oh, D.H.; Chelliah, R.; Kwon, C.; Kim, Y.J.; Chung, I.M. Assessment of phenolic and mineral profiles and their association with the antimicrobial potential, antioxidant, and cytotoxic effect of Lycium chinense Miller. Plants 2020, 9, 1023. [Google Scholar] [CrossRef] [PubMed]
  81. Araújo, K.C.F.; Costa, E.M.D.M.; Pazini, F.; Valadares, M.C.; De Oliveira, V. Bioconversion of quercetin and rutin and the cytotoxicity activities of the transformed products. Food Chem. Toxicol. 2013, 51, 93–96. [Google Scholar] [CrossRef] [PubMed]
  82. Bonechi, C.; Donati, A.; Tamasi, G.; Leone, G.; Consumi, M.; Rossi, C.; Lamponi, S.; Magnani, A. Protective effect of quercetin and rutin encapsulated liposomes on induced oxidative stress. Biophys. Chem. 2018, 233, 55–63. [Google Scholar] [CrossRef]
  83. Tamasi, G.; Baratto, M.C.; Bonechi, C.; Byelyakova, A.; Pardini, A.; Donati, A.; Leone, G.; Consumi, M.; Lamponi, S.; Magnani, A.; et al. Chemical characterization and antioxidant properties of products and by-products from Olea europaea L. Food Sci. Nutr. 2019, 7, 2907–2920. [Google Scholar] [CrossRef] [PubMed] [Green Version]
  84. Christian, L.; Freia, F.S.; Angela, R.; Szymon, K.; Daniel, K.; Bart, D.W.; Heike, W.; Florian, K.G. Alternative methods for the replacement of eye irritation testing. ALTEX 2016, 33, 55–67. [Google Scholar]
Figure 1. (A)Total phenolic content, and (B) total flavonoid content of A. japonica roots.
Agronomy 11 01327 g001
Figure 2. Representative MRM ion chromatogram of phenolic compounds from A. japonica root extracts harvested in the month of (A) October, (B) November. Extract ion chromatograms of individual phenolic metabolites with small peaks are given in rectangular boxes with their retention time.
Agronomy 11 01327 g002
Figure 3. Antioxidant activity of A. japonica roots.
Agronomy 11 01327 g003
Figure 4. The effect of root extracts concentration on cell viability on NIH 3T3 cells lines.
Agronomy 11 01327 g004
Figure 5. Cytotoxic effect of the root extracts (IC50 concentrations) on the NIH 3T3 cell lines. (i) Bright field, (ii) AO/EB staining, (iii) ROS.
Agronomy 11 01327 g005
Figure 6. HET–CAM assay. (i) NaOH (0.1 M) Positive control—Indicates Blood hemorrhage; (ii) Negative control—Non-irritant Distilled water; (iii) (1 mg/mL) Test sample—non-irritant.
Agronomy 11 01327 g006
Table 1. LC-MS/MS parameters of the phenolic compound quantitative analyses.
CompoundRTQ1 (m/z) 1Q3-1(m/z) 2DP (V) 3EP (V) 4CEP (V) 5CE (eV) 6CXP (V) 78 Phenolic Compounds
µgg−1 Dry Weight of Root Extract.)
October November
Protocatechuic acid9.61152.89 108.90 −31.00 −9.00 −8.00 −18.00 −22.00 1166.70 ± 20.90 g636.54 ± 87.72 g
p-Hydroxybenzoic acid11.71136.88 92.90−16.00 −9.50−14.00 −18.00 −18.00 LODLOD
Chlorogenic acid9.95352.84 191.00 −16.00 −9.50 −18.00 −18.00 −36.00 133833.30 ± 50.00 i5298.23 ± 38.82i
p-Coumaric acid13.95162.86 118.90 −16.00 −5.00 −8.00 −20.00 −22.00 36.80 ± 2.00 a170.33 ± 26.52 b
Ferulic acid14.27192.88 133.90 −6.000−6.50 −12.00 −22.00 −26.00 LOQLOQ
Rutin11.90609.00 299.70 −96.00 −8.00 −26.00 −48.00 −52.00 639.20 ± 10.00 e564.57 ± 13.30 e
Quercetin18.16300.88 150.80 −31.00 −10.50 −18.00 −28.00 −32.00 LODLOQ
5−Sulfosalicylic acid 6.68216.77 198.80 −21.00 −7.50 −10.00 −18.00 −44.00 LOQLOQ
Homogentisic acid8.62166.92 122.90 −21.00 −7.00 −14.00 −14.00 −28.00 LODLOD
Salicylic acid18.66136.87 92.900−16.00 −6.00 −12.00 −20.00 −20.00 536.70 ± 12.00 b354.40 ± 5.00 f
Caffeic acid10.85178.86 134.80 −11.00 −10.00 −12.00 −20.00 −30.00 583.66 ± 15.00 c146.30 ± 7.00 c
Orientin10.10447.09 327.00 −61.00 −11.00 −20.00 −22.00 −54.00 591.17 ± 17.00 cd309.69 ± 21.63d
Vitexin14.60430.82 310.80 −56.00 −9.00 −28.00 −22.00 −50.00592.00 ± 11.90 d517.66 ± 1.30 f
Apigenin21.00268.94 117.00 −56.00 −8.50 −16.00 −48.00 −22.001325.00 ± 20.00 h67.30 ± 3.00 a
Luteolin17.66284.96 133.20 −66.00 −10.00 −16.00 −46.00 −30.00869.30 ± 10.00 f946.63 ± 12.00 h
L-Phenylalanine7.00163.88146.80−51.00−10.00−12.61−16.00−30.00LODLOD
1 Precursor ion (Q1, m/z); 2 fragment ion (Q3, m/z); 3 DP: declustering potential; 4 EP: entrance potential; 5 CEP: cell entrance potential; 6 CE: collision energy; 7 CXP: collision cell exit potential, LOD: limit of detection, LOQ: limit of quantitation (LOQ). 8 Data with the same letter in a column did not differ significantly according to Tukey’s multiple comparison test (p < 0.05). Mean values within a column with the same lowercase letters were not significantly different (p < 0.05) according to Tukey’s multiple comparison test.
Table 2. Pearson correlation coefficients between the phenolic compounds and antioxidant activity of A. japonica roots extracts.
AssayTPCTFCProtocatechuic AcidChlorogenicAcidp-Coumaric AcidRutinSalicylic AcidCaffeic AcidOrientinVitexinApigeninLuteolin
DPPH (October)0.992 *0.961 *0.500 *0.655 *0.550 **0.590 *0.500 *0.817 *0.810 **0.6930.7210.655
ABTS (October)0.997 *0.997 *0.663 **0.792 *0.663 *0.663 **0.663 **0.916 **0.910 *0.8230.8450.792
DPPH (November)0.999 *0.993 *0.3110.717 *0.632 *0.767 *0.632 **0.539 *0.622 *0.5390.7670.632
ABTS (November)0.9650.911 *0.0130.4750.3710.540 *0.3710.2620.6140.2620.5400.371
* Correlation is significant at the 0.05 level (2-tailed), ** Correlation is significant at the 0.01 level (2-tailed).
Table 3. Calibration curves, limit of detection (LOD), and limit of quantitation (LOQ) of the 19 elements examined in this study.
ElementConcentration (mg L−1) aLinearity (r2)Slope (S)Response
SD
SD c
(%)
LOD bLOQ b
μg mL−1
Macro elementsCa0.5–100.99957681571103.171.150.4057261.352421
Mg0.5–100.99973819,9202106.850.940.3172971.057656
Micro elementsAl0.5–100.9999323730358.880.960.2886430.962145
Ba0.5–100.9998255071505.090.990.2988110.996036
Cd0.5–100.9998122007156.530.780.2339760.779920
Cu0.5–100.99985219,5301778.000.910.2731180.910394
Fe0.5–100.9998034031352.030.870.2619920.873307
Mn0.5–100.99990131,1203071.070.980.2960540.986848
Zn0.5–100.9997995112378.980.740.2224060.741354
Trace elementsAs0.5–100.99987647.103.540.750.2254780.751592
Bi0.5–100.999907286.538.391.340.4019901.339965
Co0.5–100.9991311197111.510.930.2794740.931579
Cr0.5–100.9998414921522.491.060.3185271.061756
Li0.5–100.99978332,1203995.401.240.3731691.243898
Ni0.5–100.9997571951174.430.890.2682160.894054
Pb0.5–100.999792277.037.921.370.4106861.368953
Se0.5–100.99991372.128.721.210.3627291.209096
Ag0.5–100.99994220,2401753.280.860.2598740.866245
Ti0.5–100.99992738,1302907.650.760.2287690.762562
a The calibration curve was obtained using 3–7 different concentrations of a standard solution for each element. b The LOD and LOQ were determined using each calibration curve as follows: LOD = 3 × SD/S and LOQ = 10 × SD/S, where SD is the standard deviation of the response and S is the slope of each calibration curve. c SD is the standard deviation of a response and S is the slope of the calibration curve.
Table 4. Mineral content in the A. japonica root extracts.
ElementsConcentration (μg mL−1)
OctoberNovember
Macro elementsCa49.34 ± 0.83892.770 ± 0.654
Mg19.66 ± 0.275028.680 ± 0.155
Micro elementsAl0.701 ± 0.00730.551 ± 0.027
Ba0.120 ± 0.00150.269 ± 0.0035
Cd0.089 ± 0.00130.090 ± 0.0019
Cu0.057 ± 0.00040.031 ± 0.0011
Fe0.953 ± 0.00630.875 ± 0.0115
Mn0.928 ± 0.01341.696 ± 0.0032
Zn0.218 ± 0.00180.303 ± 0.0047
Trace elementsAs0.142 ± 0.03640.037 ± 0.0562
Bi0.076 ± 0.04420.071 ± 0.0215
Co0.131 ± 0.00290.134 ± 0.0022
Cr0.095 ± 0.00260.095 ± 0.0010
Li0.081 ± 0.00070.081 ± 0.0004
Ni0.113 ± 0.00170.116 ± 0.0017
Pb0.076 ± 0.02230.087 ± 0.0193
Se0.143 ± 0.04430.175 ± 0.0643
Ag0.060 ± 0.00100.060 ± 0.0007
Ti0.040 ± 0.00010.040 ± 0.0003
Table 5. Pearson correlation coefficients between the phenolic compounds and cytotoxicity of the A. japonica root extracts.
Phenolic CompoundsCytotoxicity
Protocatechuic acid0.987 **
Rutin0.899
Chlorogenic acid0.978 *
p-Coumaric acid0.974 *
Salicylic acid0.908 *
Caffeic acid0.959 *
Orientin0.509
Vitexin0.350
Apigenin0.240
Luteolin0.150
** Correlation is significant at the 0.01 level (2-tailed). * Correlation is significant at the 0.05 level (2-tailed).
Table 6. Assessment of test sample irritation potential in the HET–CAM assay.
SamplesIrritation Score Irritation Assessment
Negative control0Non-irritant
NaOH (0.1 M)18.00Strong irritant
Root extracts (50 mg/mL)0Non-irritant
Publisher’s Note: MDPI stays neutral with regard to jurisdictional claims in published maps and institutional affiliations.

