Abstracts
This study highlights the analysis of the morphological and genetic variation of the common sea bream Pagrus pagrus, and compares its two main areas of concentration: the northern (35ºS - 38ºS) and the southern areas (39ºS - 41ºS) of the Buenos Aires coast of the Argentine Sea. Body shape characterization presented two significantly different morphotypes (Wilks' Lambda=0.224, P<0.001). Northern individuals displayed a higher middle area while southern ones were smaller and their caudal peduncle was shorter. The northern and southern areas did not yield significant genetic differences either with the control region or the microsatellite loci, revealing that P. pagrus is not genetically structured. However, individuals from these areas should not be managed as a single group since they display distinct life history traits, responsible for morphological differentiation. The presence of two spawning areas with distinctive characteristics would define two stocks of P. pagrus from the Buenos Aires coast.
Geometric morphometrics; Management unit; Mitochondrial DNA; Stocks
El estudio comprende un análisis de la variación morfológica y genética del besugo Pagrus pagrus, comparando dos áreas principales de concentración, una Norte (35ºS - 38ºS) y otra Sur (39ºS - 41ºS) en la costa bonaerense del Mar Argentino. La caracterización de la forma del cuerpo mostró dos morfotipos diferenciados significativamente (Wilks´ Lambda= 0.224, P<0.001), presentando en el área Norte una mayor altura en la parte media del cuerpo y una menor longitud y altura del pedúnculo caudal que los correspondientes al área Sur. Las áreas Norte y Sur no presentaron diferencias genéticas significativas, tanto para la región control del ADN mitocondrial como para los loci microsatélites, revelando que P. pagrus no está estructurado genéticamente. Sin embargo, los individuos de estas áreas no deberían manejarse como un mismo grupo ya que presentan distintas características de historia de vida, responsables de la diferenciación morfológica. La presencia de dos sitios de cría con características distintivas, definiría para P. pagrus dos stocks en la costa bonaerense.
Introduction
One of the main objectives in the field of fish conservation genetics is estimating the genetic structure of a population and defining units capable of maintaining evolutionary processes (Crandall et al., 2000Crandall, K. A., O. R. P. Bininda-Emonds, G. M. Mace & R. K. Wayne. 2000. Considering evolutionary processes in conservation biology. Trends in Ecology and Evolution, 15: 290-295.; Palumbi, 2003Palumbi, S. R. 2003. Population genetics, demographic connectivity, and the design of marine reserves. Ecological Applications, 13: S146-S158.; Manel et al., 2003Manel, S., M. Schwartz, G. Luikart & P. Taberlet. 2003. Landscape genetics: combining landscape ecology and population genetics. Trends in Ecology and Evolution, 18: 189-197.; Laikre et al., 2005Laikre, L., S. Palm & N. Ryman. 2005. Genetic population structure of fishes: implications for coastal zone management. Ambio: A Journal of the Human Environment, 34: 111-119.). The population structure of marine fishes can be examined on many levels ranging from a small to a large scale (Hauser & Ward, 1998Hauser, L. & R. D. Ward. 1998. Population identification in pelagic fish: the limits of molecular markers. Pp. 191-224. In: Carvalho, G. R. (Ed.). Advances in molecular ecology. Amsterdam, IOS Press (NATO Advanced Science Institutes Series, series A, Life Sciences, v. 306).), and analyzed from a genetic to a morphometric approach (Cadrin, 2000Cadrin, S. X. 2000. Advances in morphometric identification of fishery stocks. Reviews in Fish Biology and Fisheries, 10: 91-112.; Parsons et al., 2003Parsons, K. J., B. W. Robinson & T. Hrbek. 2003. Getting into shape: an empirical comparison of traditional trussbased morphometric methods with a newer geometric method applied to New World cichlids. Environmental Biology of Fishes, 67: 417-431.). The ability to identify units and the possibility of establishing genetic differentiation or discontinuity in nature depend on the species life history and ecology (Waples, 1998Waples, R. S. 1998. Separating the wheat from the chaff: patterns of genetic differentiation in high gene flow species. Journal of Heredity, 89: 438-450.). Physical barriers combined with oceanographic factors, such as currents, tides and biological factors, including local recruitment, larval transport potential, or reproductive strategy are the main variables that can affect fish population structure (Palumbi, 1994Palumbi, S. R. 1994. Genetic divergence, reproductive isolation, and marine speciation. Annual Review of Ecology and Systematics, 25: 547-572.). In terms of conservation, an Evolutionary Significant Unit (ESU) is primarily relevant for long-term management but, in the short term, a Management Unit or "stock" is understood as groups of individuals whose level of ecological and genetic connectivity is low enough. Hence each group must be individually monitored and managed (Ihssen et al., 1981Ihssen, P. E., H. E. Booke, J. M. Casselman, J. M. Mcglade, N. R. Payne & F. M. Utter. 1981. Stock identification: materials and methods. Canadian Journal of Fisheries and Aquatic Sciences, 38: 1838-1855.; Laikre et al., 2005; Waldman, 2005Waldman, J. R. 2005. Definition of stocks: An evolving concept. Pp. 7-16. In: Cadrin, S. X., K. D. Friedland & J. R. Waldman (Eds.). Stock Identification Methods: Applications in fishery science. Burlington, MA, Elsevier Academic Press.; Palsboll et al., 2007Palsboll, P. J., M. Bérube & F. W. Allendorf. 2007. Identification of management units using population genetic data. Trends in Ecology and Evolution, 22: 1-16.).
The common sea bream Pagrus pagrus (Linnaeus, 1758) offers a good opportunity to study many of the factors related to population structure and genetic diversity. It is widely distributed along the Mediterranean and the western and eastern Atlantic Ocean (Ball, 2007Ball, A. O., M. G. Beal, R. W. Chapman & G. R. Sedberry. 2007. Population structure of red porgy, Pagrus pagrus, in the Atlantic Ocean. Marine Biology, 150: 1321-1332.; Cousseau & Perrotta, 2004Cousseau, M. B. & R. G. Perrota (Eds.). 2004. Peces Marinos de Argentina. Biologia, distribución y pesca. Mar del Plata, Instituto Nacional de Investigación y Desarrollo Pesquero, 167p.) making up an important fishery resource (Aristizabal & Suárez, 2006Aristizábal, E. O. & J. Suárez. 2006. Efficiency of co-feeding red porgy (Pagrus pagrus L.) larvae with live and compound diet. Revista de Biología Marina y Oceanografía, 41: 203-208.). Along the Buenos Aires coast (Argentinean Biogeographical Province), P. pagrus shows a preference for rocky bottoms. It lives at a depth between 10 and 50 m in two main concentration areas herein referred to as Northern Common Sea Bream (N-CSB), found between 35º and 38ºS, and Southern Common Sea Bream (S-CSB), found between 39º and 41ºS (Fig. 1, Cousseau & Perrotta, 2004).
Map showing the study area and sampling sites. In the gray-shaded area, the distribution of Pagrus pagrus and the sampling sites both to the north (N-CSB) and to the south (S-CSB) of Buenos Aires coastal waters can be observed. The Patagonian coastal Current, which mainly move northward over the continental shelf, are represented with grey dashed arrows. Along the edge of the continental slope, the thick arrows represent the Malvinas Current that moves northward and meets the Brazil Current in the so-called Confluence Zone.
These areas have distinctive characteristics, such as temperature, salinity, depth, dynamics and speed of ocean currents, among others, which define two different oceanographic regimes (Guerrero & Piola, 1997Guerrero, R. A. 1998. Oceanografía física del estuario del Río de la Plata y el sistema costero de El Rincón. Noviembre, 1994. INIDEP Informe Técnico, 21: 29-54.; Guerrero & Lasta, 1998Guerrero, R. A. & A. R. Piola. 1997. Masas de agua en la plataforma continental. El Mar Argentino y sus recursos pesqueros, 1: 107-118.; Acha et al., 2004Acha, E. M., H. W. Mianzan, R. A. Guerrero, M. Favero & J. Bava. 2004. Marine fronts at the continental shelves of austral South America physical and ecological processes. Journal of Marine Systems, 44: 83-105.). In both systems, defined as "El Rincón" and "Río de la Plata" estuary (Fig. 1), thermal and haline fronts affect the distribution of reproductive concentrations, nurseries and spawning areas of many coastal fish species (Militelli et al., 2007Militelli, M. I., K. A. Rodrigues & M. R. Rico. 2007. Áreas de puesta y cría de las principales especies de peces óseos costeros en el Río de la Plata y la zona común de pesca Argentino-Uruguaya. INIDEP Informe Técnico 71: 1-10.). Additionally, regional differences regarding individuals size and weight have been observed, the S-CSB beinglarger than the N-CSB. Hence, it has been suggested that P. pagrus in both regions should be considered as different populations or stocks (Cotrina, 1989Cotrina, C. P. 1989. Estudio biológico del besugo (Pagrus pagrus) del Ecosistema Costero Bonaerense. Unpublished Ph. D. Dissertation, Universidad de Buenos Aires, Argentina, 161p.; Cousseau & Perrotta, 2004).
For Pagrus pagrus, preliminary genetic studies have revealed deep divisions at a large scale: between eastern North Atlantic, western North Atlantic, and western South Atlantic populations (Ball et al., 2003Ball, A. O., G. R. Sedberry, J. H. Wessel III & R. W. Chapman. 2003. Large-scale genetic differentiation of Pagrus pagrus in the Atlantic. Journal of Fish Biology, 62: 1232-1237., 2007Ball, A. O., M. G. Beal, R. W. Chapman & G. R. Sedberry. 2007. Population structure of red porgy, Pagrus pagrus, in the Atlantic Ocean. Marine Biology, 150: 1321-1332.), but shown homogeneity within areas. On the other hand, significant morphological dissimilarities have been reported for P. pagrus along the Eastern Atlantic and the Mediterranean Sea as a direct consequence of environmental adaptation (Palma & Andrade, 2004Palma, J. & J. P. Andrade. 2004. Morphological study of Pagrus pagrus, Pagellus bogaraveo, and Dentex dentex (Sparidae) in the eastern Atlantic and the Mediterranean Sea. Journal of the Marine Biological Association of the United Kingdon, 84: 449-454.). At a local scale, significant morphological differences, generally related to environmental variations in stripped weakfish Cynoscion guatucupa and white mouth croaker Micropogonias furnieri (Sabadin et al., 2010Sabadin, D. E., M. González-Castro, C. Iudica, J. M. Diáz de Astarboa & P. J. Fernández-Iriarte. 2010. Morphometric and genetic assessment of the Cynoscion guatucupa population structure from Buenos Aires coast, Argentine Sea. Revista de Biología Marina y Oceanografía, 45: 513-517.; D'Anatro et al., 2011D'Anatro, A., A. N. Pereira & E. P. Lessa. 2011. Genetic structure of the white croaker, Micropogonias furnieri Desmarest, 1823 (Perciformes: Sciaenidae) along Uruguayan coasts: contrasting marine, estuarine, and lacustrine populations. Environmental Biology of Fishes, 91: 407-420.) have also been informed on the Buenos Aires coast of the Argentine Sea.
Like in any broadly distributed marine fish species that exhibit high dispersal, low levels of population differentiation are expected to be reported for Pagrus pagrus at the Southwestern Atlantic. However, the adaptive local traits of spawning areas which affect the morphological patterns may justify isolated management and the consideration of different fishery stocks. The purpose so this research was to study body shape variability between S-CSB and N-CSB through landmark-based geometric morphometrics. Likewise, in order to analyze the genetic structure, mitochondrial sequences and two microsatellite loci were assessed.
Material and Methods
For this study, both N-CSB and S-CSB P. pagrus were collected during August 2010. The N-CSB sample was obtained from a traditional fishing boat 52 km north from Mar del Plata city (37º00'2.73"S 55º56'58.54"W) at a depth between 27 and 30 m. The S-CSB sample came from a landing sampling (39º26'42.32"S 59º48'21.21"W) 365 km southwest from N-SCB (Fig. 1). Fish were grouped by sex, and gonadal stage was macroscopically determined (Cotrina & Christiansen, 1994Cotrina, C. P. & H. E. Christiansen. 1994. El comportamiento reproductivo del besugo (Pagrus pagrus) en el ecosistema costero bonaerense. Revista de Investigación y Desarrollo Pesquero, 9: 25-28.). They were weighed, and total length (TL) was measured using an ictiometer. A small sample of muscular tissue was dissected to conduct genetic studies. To avoid the influence of allometric effects, only adult individuals with size ranges similar in both samples were used: 25 to 33 cm (mean 28 ± 2.4) from N-CSB and 25 to 35 cm (mean 29 ± 3.4) from S-CSB.
DNA was extracted from all samples using the Chelex 100 resin method (Sambrook et al., 1989Sambrook, J., E. F. Fritsch & T. Maniatis. 1989. Molecular cloning: a laboratory manual, 2nd. ed. New York, Cold Spring Harbor Laborator Press. v.1.), verifying its isolation and quality by electrophoresis in agarose gel (Estoup et al., 1996Estoup, A., C. R. Largiadèr, E. Perrot & D. Chourrout. 1996. Rapid one-tube DNA extraction for reliable PCR detection of fish polymorphic markers and transgenes. Molecular Marine Biology and Biotechnology, 5: 295-298.). The amplification of a partial fragment of the mitochondrial control region of the P. pagrus was conducted with primers BES-1F and E (Ball et al., 2007Ball, A. O., M. G. Beal, R. W. Chapman & G. R. Sedberry. 2007. Population structure of red porgy, Pagrus pagrus, in the Atlantic Ocean. Marine Biology, 150: 1321-1332.). The amplification conditions and the cycling program were described by Beheregaray & Sunnucks (2001)Beheregaray, L. B. & P. Sunnucks. 2001. Fine-scale genetic structure, estuarine colonization and incipient speciation in the marine silverside fish Odontesthes argentinensis. Molecular Ecology, 10: 2849-2866.. The PCR product was purified and sent for sequencing to MACROGEN (Korea). Two microsatellite loci were used, PaGa2a and SauH98, marked with 6-Fam and Hex, respectively (Navarro et al., 2008Navarro, A., R. Badilla, M. J. Zamorano, V. Pasamontes, S. Hildebrandt, J. J. Sánchez & J. M. Afonso. 2008. Development of two new microsatellite multiplex PCRs for three sparid species: Gilthead seabream (Sparus auratus L.), red porgy (Pagrus pagrus L.) and redbanded seabream (P. auriga, Valenciennes, 1843) and their application to paternity studies. Aquaculture, 285: 30-37.). The amplification reaction of each locus was performed in a final volume of 12.5 ml using the following components: 1.25 ml 10X PCR buffer (100mM Tris-HCl pH 8.3, 500mM KCl, 15mM MgCl2), 1ml dNTPs (10 mM), 1ml of each primer (0.04 mM), 1 ml BSA (0.8 mg/ml), 0.25ml Taq DNA polymerase (0.05 U/ml), 1 ml (10-40 ng) DNA, completing the final reaction volume with H2O (Navarro et al., 2008). The amplification was conducted in line with the following program: an initial denaturation at 94ºC for 10 min, 30 cycles 30 second long at 94 ºC, 60ºC for 1 min, 72ºC for 1 minand 65ºC for 20 min. After amplification, a 5 ml aliquot from each PCR sample was taken in order to perform a 2% agarose gel electrophoresis at 100 V for 45 min, visualized with ethidium bromide (10 mg/ml) in an UV transilluminator to check microsatellite amplification. Each locus amplification product was sent to MACROGEN (Korea) for genotyping.
Sequences were manually aligned using PROSEQ (Filatov, 2002Filatov, D. A. 2002. ProSeq: a software for preparation and evolutionary analysis of DNA sequence data sets. Molecular Ecology Notes, 2: 621-624.). For each sampling site, haplotype (h) and nucleotide (p) diversity were estimated using DNAsp v5 (Librado & Rozas, 2009Librado, P. & J. Rozas. 2009. DnaSP v5: a software for comprehensive analysis of DNA polymorphism data. Bioinformatics, 25: 1451-1452.). The genetic structure was assessed using the Analysis of Molecular Variance in ARLEQUIN 3.11 (Excoffier et al., 2005Excoffier, L., G. Laval & S. Schneider. 2005. Arlequin (version 3.0): an integrated software package for population genetics data analysis. Evolutionary Bioinformatics Online, 1: 47-50.). The haplotype median-joining network was constructed using Network 4.6 (Bandelt et al., 1999Bandelt, H. J. 1999. Network (4.6). Available from http://www.fluxus-engineering.com/sharenet.htm.
http://www.fluxus-engineering.com/sharen...
). The length of the microsatellite loci was calculated using Peak Scanner v1.0 (Applied Biosystems). The observed (Ho) and expected (He) heterozygosities, the number of alleles observed(A
O) and the effective number of alleles (A
E) were estimated by means of GenAlEx (Peakall & Smouse, 2006Peakall, R. & P. E. Smouse. 2006. GENALEX 6: genetic analysis in Excel. Population genetic software for teaching and research. Molecular Ecology Notes, 6: 288-295.). For both markers, FST index between samples were estimated using the distance method in AMOVA with 10000 permutations in ARLEQUIN 3.11 (Excoffier et al., 2005). The number of migrants per generation as an indirect estimator of gene flow was calculated by Nm = [(1 / Fst) - 1] / 4 (Wright, 1949Wright, S. 1949. The genetical structure of populations. Annals of Eugenics, 15: 323-354.). The posterior probability of the number of clusters (K=1, 2 or 3) was calculated with Bayesian tools in three runs using STRUCTURE (Pritchard et al., 2000Pritchard, J. K., M. Stephens & P. Donnelly. 2000. Inference of population structure using multilocus genotype data. Genetics, 155: 945-959.). The Ancestry model was used with default parameters and a burnin period of 100,000 and 1,000,000 (MCMC) simulations.
One of the most widely known methods applied to the analysis of body shape geometry is the one based on anatomical points or landmarks. In this way, only body shape is compared, excluding the effects of size, position, orientation and scale (Richtsmeier et al., 2002Richtsmeier, J. T., V. B. Deleon & S. R. Lele. 2002. The promise of geometric morphometrics. Yearbook of Physical Anthropology, 45: 63-91.; Parsons et al., 2003; Adams et al., 2004Adams, D. C., F. J. Rohlf & D. E. Slice. 2004. Geometric morphometrics: ten years of progress following the "revolution". Italian Journal of Zoology, 71: 5-16.).
A total of 113 specimens (59: 24 males/35 females from N-CSB and 54: 21 males/33 females from S-CSB) were sampled. They were placed on their right side on a white surface with their fins extended in order to take pictures. A digital camera (Sony cyber-shot DSC-W30), placed on a firm support to keep a right angle and height, was used. Thirteen landmarks were taken into account (Fig. 2). From each picture, a digital TPS (Thin-plane spline) file was generated with X and Y coordinates for each homologous point through Tps Dig V 2.16 (Rohlf & Marcus, 1993Rohlf, F. J. & L. F. Marcus. 1993. A revolution in morphometrics. Trends in Ecology and Evolution, 8: 129-132.). Landmark coordinates were adjusted using a generalized least squares procrustes superimposition. Procrustes of the mean landmark configuration were computed in conjunction with translation adjustments, scaling, and rotation in order to remove shape unrelated data. Then a consensus form comprising the mean coordinates for each landmark averaged across all specimens was estimated, which deformed and warped shape based on the consensus configuration of each specimen and assessed their partial warps through Relative Warps v.1.44 (Rohlf, 1994Rohlf, F. J. 1994. TPSRW: thin-plate spline relative warp analysis. Stony Brook, N. Y. , Department of Ecology and Evolution, State University of New York at, Stony Brook.). The scores of the partial warp containing more shape information than those of the linear trusses were transformed into relative warp scores and saved as a data file (Bookstein, 1991Bookstein, F. L. 1991. Morphometric tools for landmark data: geometry and biology. Cambridge, New York, Cambridge University. 435p.). All the morphometric software (TPSdig2, TPSRelw, TPSRegr, TPSUtil) used are available from http://life.bio.sunysb.edu/morph. The coordinated data were transformed and grouped by sample and sex using PAST (Hammer et al., 2001Hammer, O., D. A. T. Harper & P. D. Ryan. 2001. PAST: paleontological statistics software package for education and data analysis. Palaeontologia Electronica, 4: 9pp. Available from: http://palaeo-electronica.org/2001_1/past/issue1_01.htm.
http://palaeo-electronica.org/2001_1/pas...
). Subsequently, a multivariate analysis of variance (MANOVA) was conducted between sexes within each area and among individuals between areas. Moreover, shape description variation was obtained through a principal component analysis (PCA) and the three first principal components were represented in a3D Scatter plot using STATISTICA 7.
Location of the 13 anatomical landmarks of Pagrus pagrus: (1) anterior tip of the snout, (2) dorsal surface of the head at the nearest point to the eye globe, (3) origin of the dorsal fin, (4) 8th ray of the dorsal fin, (5) 16th ray of the dorsal fin, (6) posterior end of the dorsal fin, (7) dorsal origin of the caudal fin, (8) ventral origin of the caudal fin, (9) insertion of the anal fin, (10) origin of the anal fin, (11) insertion of the pelvic fin, (12) origin of the pelvic fin, (13) posterior insertion of the sub-operculum.
Results
A 398 bp fragment of mitochondrial DNA from the control region of 10 N-CSB samples and 13 S-CSB samples was amplified, and 34 variable sites and 18 different haplotypes were observed. Haplotype and nucleotide diversity were slightly higher for N-CBS (h= 1.000 ±0.002, π =0.02 ±0.002) than for S-CSB (h= 0.936 ±0.05, π=0.011 ±0.001); and no significant genetic differences between N-CSB and S-CSB(ΦST= 0.025, p= 0.186) were observed. Variability was greater within samples (97 %) than between them (Table 1). The haplotype median-joining network (Fig. 3) displayed 10 haplotypes for N-CSB and 9 for S-CSB. From these haplotypes, just one (haplotype 4) was shared by both areas (and shared by one individual from N-CSB and three from S-CSB), two haplotypes of S-CSB were shared by two individuals (H15 and H17), and the remaining fifteen individuals were represented by unique haplotypes.
Analysis of Molecular Variance (AMOVA) of Pagrus pagrus from the Buenos Aires coast to the partial sequence of the mitochondrial DNA control region (CR) and two microsatellite loci (ML). df =degree of freedom.
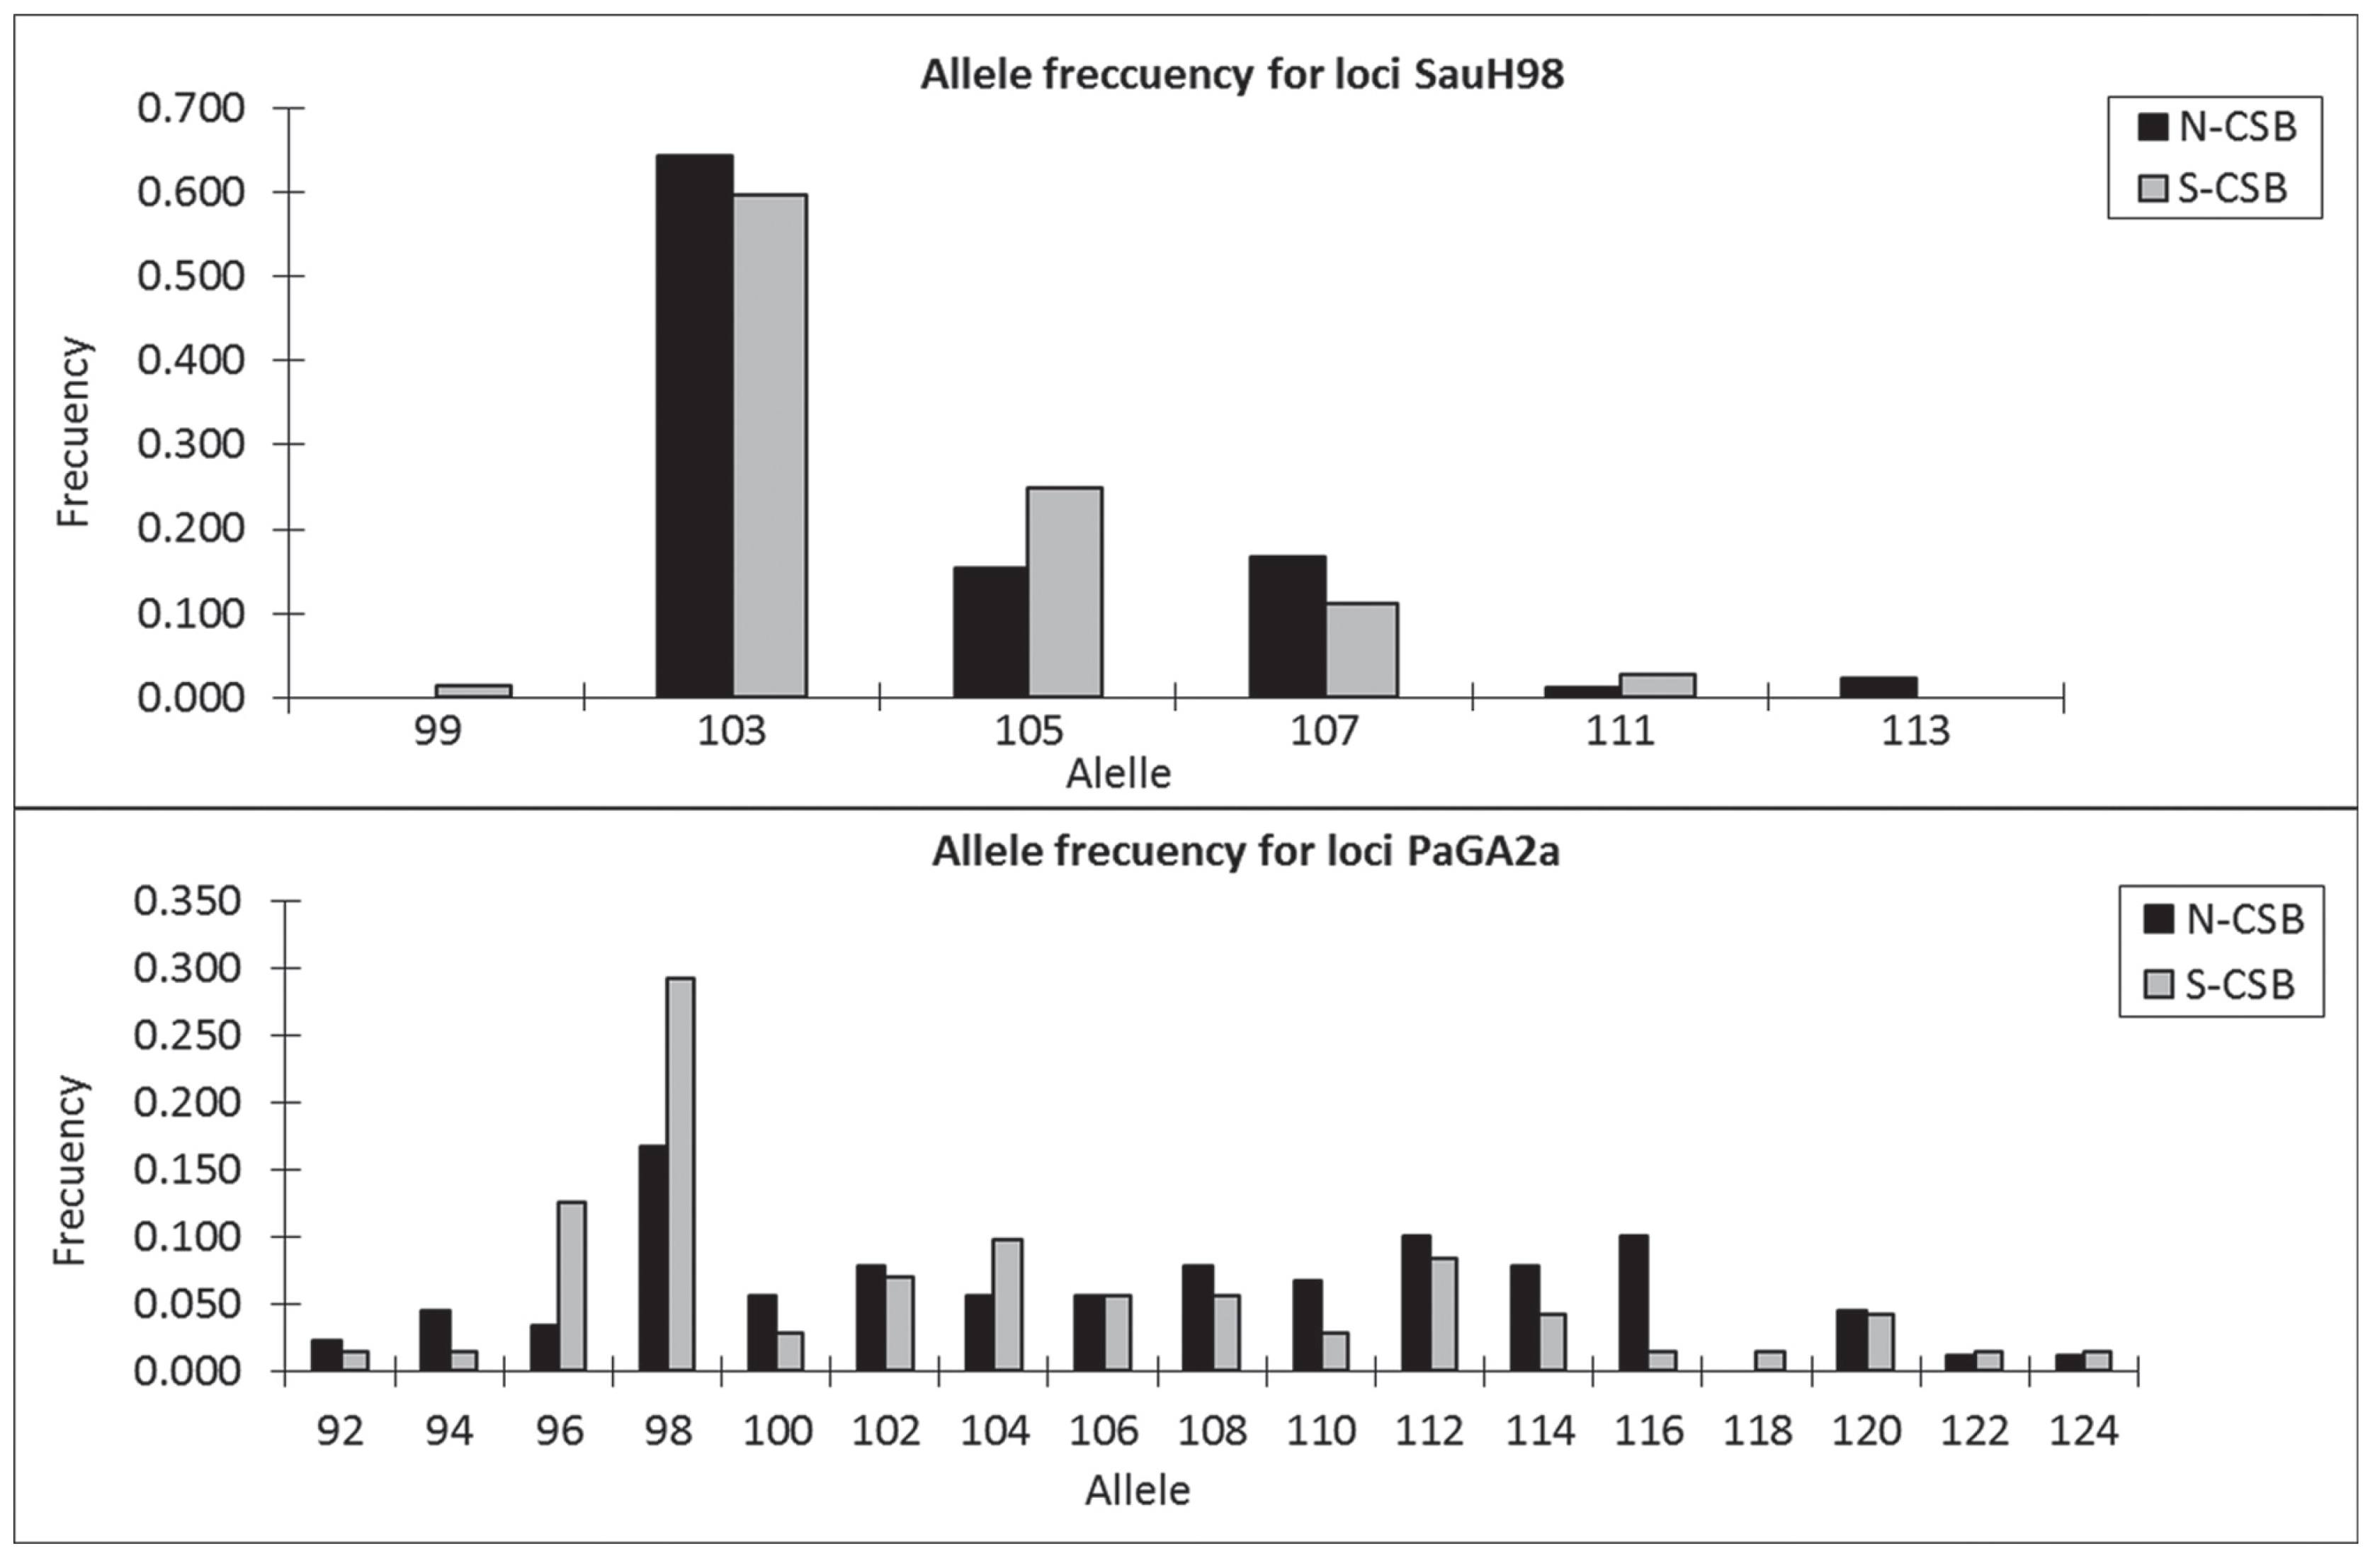
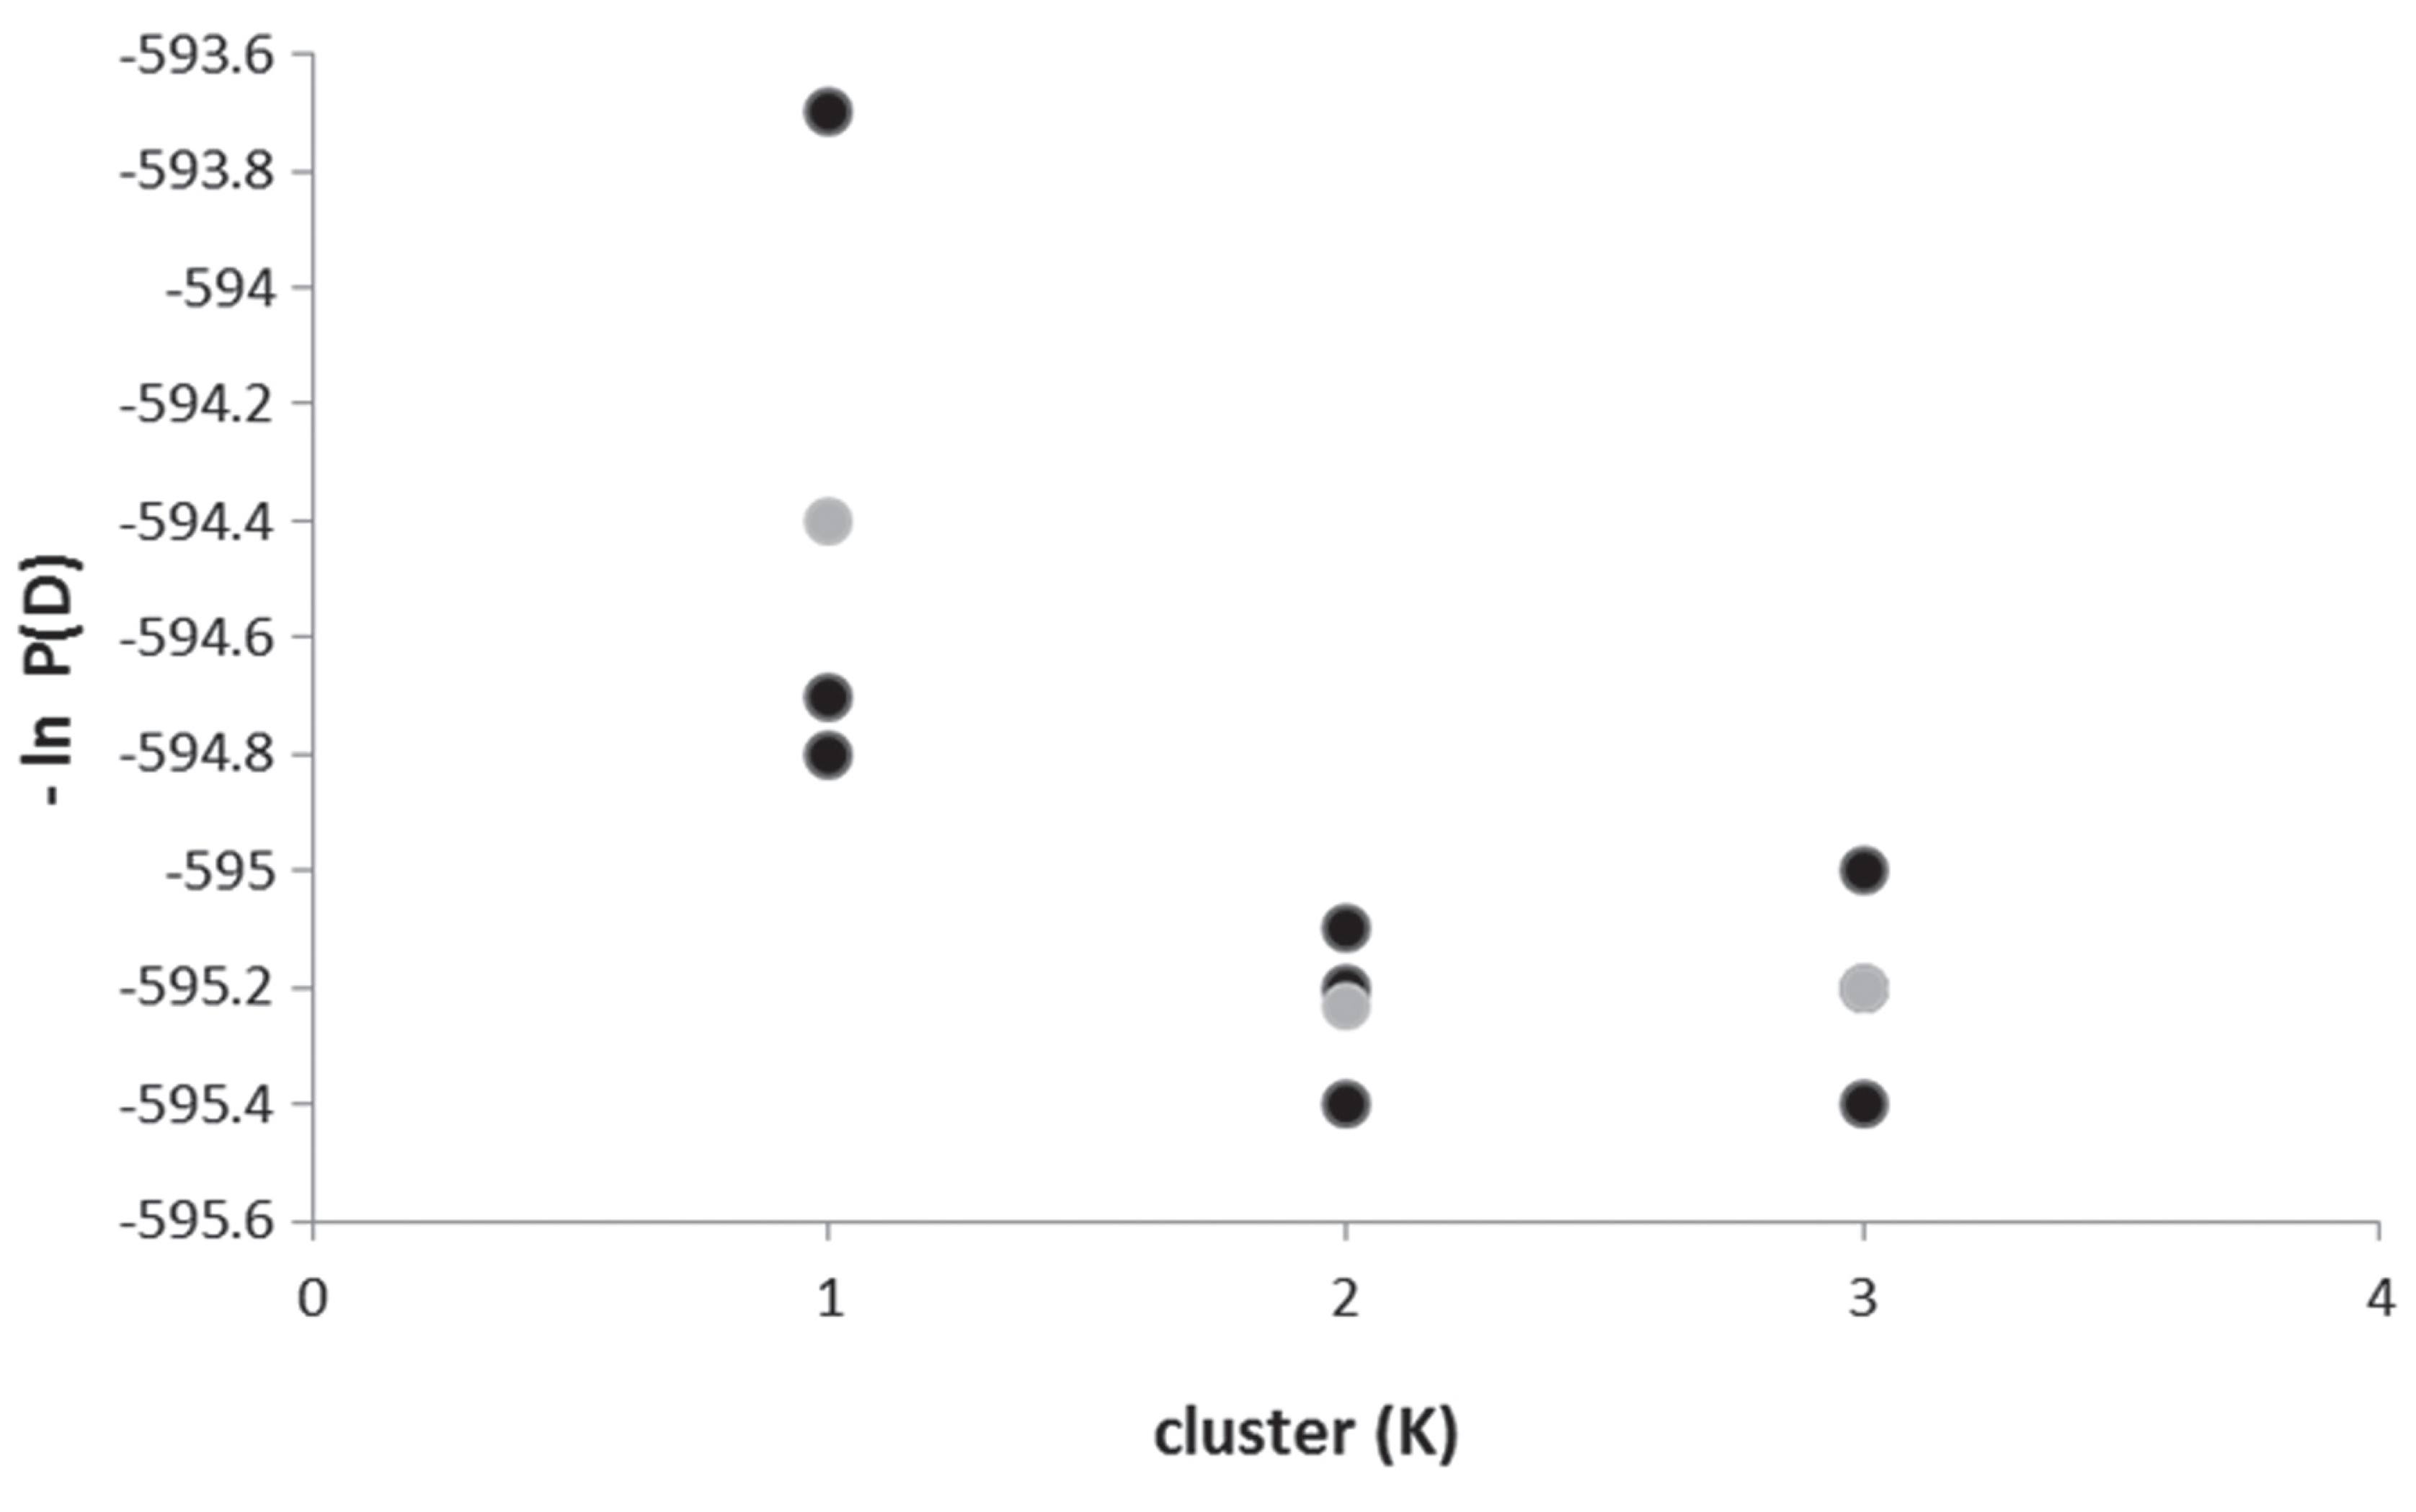
Both microsatellite loci met Hardy-Weinberg equilibrium in N-CSB (exact tests: Locus PaGa2a: p= 0.923, Locus SauH98: p= 0.097) and in S-CSB (PaGa2a: p= 0.224, LocusSauH98: p= 0.093), and exhibited high variability: PaGa2a locus showed 16 alleles for N-CSB and 17 for S-CSB, while SauH98 locus showed 5 alleles in both samples (Table 2, Fig. 4). AMOVA revealed that there was no significant genetic structure since the greatest variability was found within samples rather than between them (Table 1). In this regard, the genetic differentiation index between N-CSB and S-CSB was very low and not significant (ΦST= 0.007, p= 0.079). The number of migrants (Nm) between N-CSB and S-CSB was estimated at 35. The STRUCTURE confirmed the absence of population genetic structure, since the number of different clusters (k) in P. pagrus from the Buenos Aires coast yielded the most positive values of maximum posterior probability for K= 1 (Fig. 5).
The haplotype median-joining network of Pagrus pagrus for both N-CSB (Black) and S-CSB (Grey). The size of the circle is proportional to the frequency, and the distance between circles reflects the number of mutations.
Allele frequencies from both microsatellite loci of Pagrus pagrus: SauH98 and PaGa2a for N-CSB and S-CSB samples.
Likelihood values for inferred number of genetic clusters (K) from STRUCTURE of Pagrus pagrus. The black circles represent three simulation values for each cluster, and the grey circle the average value.
Regarding the body shape analysis, MANOVA yielded marginally significant differences between males and females within N-CSB: Wilks' Lambda= 0. 422, F(22:30)= 1.865, p= 0.056, and no significant differences in S-CSB: Wilks' Lambda= 0.470, F(22:31) = 1.592, p= 0.115. On the other hand, highly significant differences were obtained when comparing between samples: N-CSB vs. S-CSB, Wilks' Lambda= 0. 224, F(22:90)= 14.210, p= 1.31-20. The analysis of the main components indicated that the first three components explained 56% of the total variance (PC1: 25%, PC2: 17%, PC3: 14%). Landmark displacement from consensus between N-CSB and S-CSB involved mainly landmarks 1, 3, 4, 5, 7, 8, 11, and 12. These warps describe local shape variations by displaying the non-uniform local deformations that the shape undergoes with respect to the reference configuration. The differences between S-CSB and N-CSB are clearly revealed in a 3D-PCA scatter plot together with the relative warps configurations (Fig. 6). This analysis helped to clearly define two morphotypes: N-CSB, as compared to S-CSB, presented differences in the height of the jaw joint insertion, greater body height, and shorter peduncle length.
3D scatter plot of Principal Component and Grids of Relative Warps associated to different morphotypes of Pagrus pagrus. The S-CSB and N-CSB morphotypes are shown under the principal components graph (PC1, PC2 and PC3). S-CSB is represented with grey circles and N-CSB with black circles.
Discussion
The population structure comparison of Pagrus pagrus between samples from Río de la Plata (N-SCB) and El Rincón (S-SCB) indicate different scenarios for both genetic and morphological variation. The data reveal that Pagrus pagrus did not show significant genetic differences in the control region (FST= 0.025) nor in the microsatellite loci (FST= 0.007) from Northern and Southern samples from the Buenos Aires coast. Variations within sites were greater than between them, so it could be as certained that P. pagrus from the Buenos Aires coast is not genetically structured. As postulated by Ball et al. (2007)Ball, A. O., M. G. Beal, R. W. Chapman & G. R. Sedberry. 2007. Population structure of red porgy, Pagrus pagrus, in the Atlantic Ocean. Marine Biology, 150: 1321-1332., P. pagrus does not display any degree of genetic structure in the same regions of several different oceans. This absence of geographic variation could be explained by the high migration rate at adult and/or larval stages. Despite the fact that adult P. pagrus is considered a relatively sedentary fish (Parker, 1990Parker, R. O. Jr. 1990. Tagging studies and diver observations of fish populations on live-bottom reefs of the U.S. southeastern coast. Bulletin of Marine Science, 46: 749-760.) the genetic homogenization between both areas over time could be attributed to larval dispersion by coastal currents. In this sense, the western branch of Malvinas Current helps form the Patagonian Coastal Current which moves northwards over the continental shelf and transfers cold sub-Antarctic waters of low salinity due to the addition of continental waters. Moreover, during spring and summer, prevailing northeastern winds affect the discharge from the Río de la Plata and push the plume with a South-Southwestern direction also related to the warm Brazil Current which enters the system from the north and meets the Malvinas Current in the so-called Confluence Zone about 38ºS (Piola & Rivas, 1997Piola A. R. & R. P. Matano. 2001. Brazil and Falklands (Malvinas) currents. Pp. 340-349. In: Steele, J. H., S. A. Thorpe & K. K. Turekian (Eds.). Encyclopedia of ocean sciences. San Diego, Academic Press.; Piola & Matano, 2001Piola A. R. & A. L. Rivas. 1997. Corrientes en la plataforma continental. El Mar Argentino y sus recursos pesqueros, 1: 119-132., Fig. 1). Several dynamic factors such as river discharge volume, coastal currents and surface wind may or may not act as a barrier to the displacement of the larvae and establishment of different populations. Despite the lack of clear evidence regarding coastal current dynamics along the coast of South America affecting P. pagrus, previous studies on other species have suggested the role of ocean currents in modeling the genetic structure by promoting specific local larval retention (Benevides et al., 2014Benevides, E. A., M. N. S. Vallinoto, A. F. H. Fetter Filho, J. R. B. de Souza, G. Silva-Oliveira, M. O. Freitas, B. P. Ferreira, M. Hostim-Silva, A. A. Bertoncini, F. Blanchard & R. A. Torres. 2014. When physical oceanography meets population genetics: the case study of the genetic/evolutionary discontinuity in the endangered goliath grouper (Epinephelus itajara; Perciformes: Epinephelidae) with comments on the conservation of the species. Biochemical Systematics and Ecology, 56: 255-266.).
This genetic homogeneity could suggest the existence of only one genetic unit for Pagrus pagrus between the areas from the Buenos Aires coast. Similar results were found for the genetic population structure of Micropogonias furnieri (Pereira et al., 2009Pereira, A. N., A. Márquez, M. Marin & Y. Marin. 2009. Genetic evidence of two stocks of the white mouth croaker Micropogonias furnieri in the Río de la Plata and oceanic front in Uruguay. Journal of Fish Biology, 75: 321-331.) and of C. guatucupa (Sabadin et al., 2010; Fernandez Iriarte et al., 2011Fernández Iriarte, P. J., M. P. Alonso, D. E. Sabadin, P. A. Arauz & C. M. Iudica. 2011. Phylogeography of weak fish Cynoscion guatucupa (Perciformes: Sciaenidae) from the southwestern Atlantic. Scientia Marina, 75: 701-706.).
The morphological analysis of body shape yielded significant differences between N-CSB and S-CSB for Pagrus pagrus. Phenotypic dissimilarity was found regarding body height and caudal peduncle height and length. These variation patterns could reflect phenotypic plasticity due to genetic differences or simply the "morphological drift" effect. Despite the fact that phenotypic differences do not provide direct evidence of genetic isolation, they can indicate the prolonged separation of post larval fish in different environmental regimes (Campana et al., 1995Campana, S. E., J. A. Gagné & J. W. McLaren. 1995. Elemental fingerprinting of fish otoliths using ID-ICPMS. Marine Ecology Progress Series, 122: 115-120.). The "Río de La Plata" estuary and "El Rincon" constitute multispecific nursery and feeding areas since internal water recirculation in both zones favors larval retention (Acha et al., 2004; Militelli et al., 2007). The presence of two different spawning areas for P. pagrus could affect early stages of development (different inflection points during larva ontogeny) and be responsible for morphological differentiation of adult individuals.
In previous studies, Palma & Andrade (2004) documented significant morphological differences for P. pagrus between the eastern Atlantic Ocean and the Mediterranean. Emphasis was placed on the great body plasticity and related the differences found to the presence of oceanographic fronts. A similar variation pattern was observed for C. guatucupa from the Buenos Aires coast (Sabadin et al., 2010).
For instance, genetic homogeneity was observed for P. pagrus in the Northwestern Atlantic; however, the areas within this region should not be managed as a single group since they display different life history traits (Ball et al., 2007Ball, A. O., M. G. Beal, R. W. Chapman & G. R. Sedberry. 2007. Population structure of red porgy, Pagrus pagrus, in the Atlantic Ocean. Marine Biology, 150: 1321-1332.). For Pagrus aurata from the Australian west coastline, three stocks were recognized based on reproductive dynamic differences (growth, egg and larval retention), related to different breeding areas and hydrodynamic models (Jackson, 2007Jackson, G. 2007. Thus, morphometric stock identification of a species with strong sexual dimorphism and geographic differences in size at maturity should be successful. Murdoch University, West Australia .). Larval and adult dispersion patterns under the influence of tides were identified, maintaining a panmictic population (Sumpton et al., 2008Sumpton, W. D., J. R. Ovenden, C. P. Keenan & R. Street. 2008. Evidence for a stock discontinuity of snapper (Pagrus auratus) on the east coast of Australia. Fisheries Research, 94: 92-98.).
In this respect, taking into account Pagrus pagrus management in Buenos Aires coastline, N-CSB and S-CSB samples would be considered as the same genetic unit; however, they could be regarded as two different stocks based on their phenotypic differences. These morphological differences suggest that the genetic homogeneity encountered in nearby areas does not imply that they should be considered as the same stock. Correlations between character variation and environmental patterns may be related to survival and reproductive fitness of natural populations (Conover & Schultz, 1995Conover, D. O. & E. T. Schultz. 1995. Phenotypic similarity and the evolutionary significance of counter gradient variation. Trends in Ecology and Evolution, 10: 248-252., 1997Conover, D. O. & E. T. Schultz. 1997. Natural selection and the evolution of growth rate in the early life history: what are the trade-offs? Pp. 305-332. In: Chambers, R. C. & E. A. Trippel (Eds.). Early life history and recruitment in fish populations. London, Chapman & Hall.; Swain et al., 2005Swain, D. P., J. A. Hutchings & C. J. Foote. 2005. Environmental and genetic influences on stock identification characters. Pp. 45-85. In: Cadrin, S. X., K. D. Friedland & J. R. Waldman. (Eds.). Stock identification methods: applications in fishery science. Burlington, MA, Elsevier Academic Press.). These fitness differences, together with the local adaptation processes, would justify stocks acknowledgment (Palumbi, 1994Palumbi, S. R. 1994. Genetic divergence, reproductive isolation, and marine speciation. Annual Review of Ecology and Systematics, 25: 547-572.; Cadrin, 2000; Crandall et al., 2000).
Teleost morphotype seems to be flexible enough, and so the morphological structure does not need to be equally limited in different habitats. Conversely, each characteristic body shape takes advantage of the aquatic environment on the basis of its morphology and ecology.
Acknowledgements
We appreciate the contribution of two anonymous reviewers who helped improve this manuscript. This work was supported by the following grants: PIP 2504 (Comisión Nacional de Investigaciones Científicas y Técnicas), 15/E534 (Universidad Nacional de Mar del Plata) and founds from the Mariculture and Experimental Biology Program (INIDEP). PFI is member of the Scientific Researcher Program of CONICET (Argentina).
References
- Acha, E. M., H. W. Mianzan, R. A. Guerrero, M. Favero & J. Bava. 2004. Marine fronts at the continental shelves of austral South America physical and ecological processes. Journal of Marine Systems, 44: 83-105.
- Adams, D. C., F. J. Rohlf & D. E. Slice. 2004. Geometric morphometrics: ten years of progress following the "revolution". Italian Journal of Zoology, 71: 5-16.
- Aristizábal, E. O. & J. Suárez. 2006. Efficiency of co-feeding red porgy (Pagrus pagrus L.) larvae with live and compound diet. Revista de Biología Marina y Oceanografía, 41: 203-208.
- Ball, A. O., G. R. Sedberry, J. H. Wessel III & R. W. Chapman. 2003. Large-scale genetic differentiation of Pagrus pagrus in the Atlantic. Journal of Fish Biology, 62: 1232-1237.
- Ball, A. O., M. G. Beal, R. W. Chapman & G. R. Sedberry. 2007. Population structure of red porgy, Pagrus pagrus, in the Atlantic Ocean. Marine Biology, 150: 1321-1332.
- Bandelt, H. J. 1999. Network (4.6). Available from http://www.fluxus-engineering.com/sharenet.htm
» http://www.fluxus-engineering.com/sharenet.htm - Beheregaray, L. B. & P. Sunnucks. 2001. Fine-scale genetic structure, estuarine colonization and incipient speciation in the marine silverside fish Odontesthes argentinensis. Molecular Ecology, 10: 2849-2866.
- Benevides, E. A., M. N. S. Vallinoto, A. F. H. Fetter Filho, J. R. B. de Souza, G. Silva-Oliveira, M. O. Freitas, B. P. Ferreira, M. Hostim-Silva, A. A. Bertoncini, F. Blanchard & R. A. Torres. 2014. When physical oceanography meets population genetics: the case study of the genetic/evolutionary discontinuity in the endangered goliath grouper (Epinephelus itajara; Perciformes: Epinephelidae) with comments on the conservation of the species. Biochemical Systematics and Ecology, 56: 255-266.
- Bookstein, F. L. 1991. Morphometric tools for landmark data: geometry and biology. Cambridge, New York, Cambridge University. 435p.
- Cadrin, S. X. 2000. Advances in morphometric identification of fishery stocks. Reviews in Fish Biology and Fisheries, 10: 91-112.
- Campana, S. E., J. A. Gagné & J. W. McLaren. 1995. Elemental fingerprinting of fish otoliths using ID-ICPMS. Marine Ecology Progress Series, 122: 115-120.
- Conover, D. O. & E. T. Schultz. 1995. Phenotypic similarity and the evolutionary significance of counter gradient variation. Trends in Ecology and Evolution, 10: 248-252.
- Conover, D. O. & E. T. Schultz. 1997. Natural selection and the evolution of growth rate in the early life history: what are the trade-offs? Pp. 305-332. In: Chambers, R. C. & E. A. Trippel (Eds.). Early life history and recruitment in fish populations. London, Chapman & Hall.
- Cotrina, C. P. 1989. Estudio biológico del besugo (Pagrus pagrus) del Ecosistema Costero Bonaerense. Unpublished Ph. D. Dissertation, Universidad de Buenos Aires, Argentina, 161p.
- Cotrina, C. P. & H. E. Christiansen. 1994. El comportamiento reproductivo del besugo (Pagrus pagrus) en el ecosistema costero bonaerense. Revista de Investigación y Desarrollo Pesquero, 9: 25-28.
- Cousseau, M. B. & R. G. Perrota (Eds.). 2004. Peces Marinos de Argentina. Biologia, distribución y pesca. Mar del Plata, Instituto Nacional de Investigación y Desarrollo Pesquero, 167p.
- Crandall, K. A., O. R. P. Bininda-Emonds, G. M. Mace & R. K. Wayne. 2000. Considering evolutionary processes in conservation biology. Trends in Ecology and Evolution, 15: 290-295.
- D'Anatro, A., A. N. Pereira & E. P. Lessa. 2011. Genetic structure of the white croaker, Micropogonias furnieri Desmarest, 1823 (Perciformes: Sciaenidae) along Uruguayan coasts: contrasting marine, estuarine, and lacustrine populations. Environmental Biology of Fishes, 91: 407-420.
- Estoup, A., C. R. Largiadèr, E. Perrot & D. Chourrout. 1996. Rapid one-tube DNA extraction for reliable PCR detection of fish polymorphic markers and transgenes. Molecular Marine Biology and Biotechnology, 5: 295-298.
- Excoffier, L., G. Laval & S. Schneider. 2005. Arlequin (version 3.0): an integrated software package for population genetics data analysis. Evolutionary Bioinformatics Online, 1: 47-50.
- Fernández Iriarte, P. J., M. P. Alonso, D. E. Sabadin, P. A. Arauz & C. M. Iudica. 2011. Phylogeography of weak fish Cynoscion guatucupa (Perciformes: Sciaenidae) from the southwestern Atlantic. Scientia Marina, 75: 701-706.
- Filatov, D. A. 2002. ProSeq: a software for preparation and evolutionary analysis of DNA sequence data sets. Molecular Ecology Notes, 2: 621-624.
- Guerrero, R. A. 1998. Oceanografía física del estuario del Río de la Plata y el sistema costero de El Rincón. Noviembre, 1994. INIDEP Informe Técnico, 21: 29-54.
- Guerrero, R. A. & A. R. Piola. 1997. Masas de agua en la plataforma continental. El Mar Argentino y sus recursos pesqueros, 1: 107-118.
- Hammer, O., D. A. T. Harper & P. D. Ryan. 2001. PAST: paleontological statistics software package for education and data analysis. Palaeontologia Electronica, 4: 9pp. Available from: http://palaeo-electronica.org/2001_1/past/issue1_01.htm
» http://palaeo-electronica.org/2001_1/past/issue1_01.htm - Hauser, L. & R. D. Ward. 1998. Population identification in pelagic fish: the limits of molecular markers. Pp. 191-224. In: Carvalho, G. R. (Ed.). Advances in molecular ecology. Amsterdam, IOS Press (NATO Advanced Science Institutes Series, series A, Life Sciences, v. 306).
- Ihssen, P. E., H. E. Booke, J. M. Casselman, J. M. Mcglade, N. R. Payne & F. M. Utter. 1981. Stock identification: materials and methods. Canadian Journal of Fisheries and Aquatic Sciences, 38: 1838-1855.
- Jackson, G. 2007. Thus, morphometric stock identification of a species with strong sexual dimorphism and geographic differences in size at maturity should be successful. Murdoch University, West Australia .
- Laikre, L., S. Palm & N. Ryman. 2005. Genetic population structure of fishes: implications for coastal zone management. Ambio: A Journal of the Human Environment, 34: 111-119.
- Librado, P. & J. Rozas. 2009. DnaSP v5: a software for comprehensive analysis of DNA polymorphism data. Bioinformatics, 25: 1451-1452.
- Manel, S., M. Schwartz, G. Luikart & P. Taberlet. 2003. Landscape genetics: combining landscape ecology and population genetics. Trends in Ecology and Evolution, 18: 189-197.
- Militelli, M. I., K. A. Rodrigues & M. R. Rico. 2007. Áreas de puesta y cría de las principales especies de peces óseos costeros en el Río de la Plata y la zona común de pesca Argentino-Uruguaya. INIDEP Informe Técnico 71: 1-10.
- Navarro, A., R. Badilla, M. J. Zamorano, V. Pasamontes, S. Hildebrandt, J. J. Sánchez & J. M. Afonso. 2008. Development of two new microsatellite multiplex PCRs for three sparid species: Gilthead seabream (Sparus auratus L.), red porgy (Pagrus pagrus L.) and redbanded seabream (P. auriga, Valenciennes, 1843) and their application to paternity studies. Aquaculture, 285: 30-37.
- Palma, J. & J. P. Andrade. 2004. Morphological study of Pagrus pagrus, Pagellus bogaraveo, and Dentex dentex (Sparidae) in the eastern Atlantic and the Mediterranean Sea. Journal of the Marine Biological Association of the United Kingdon, 84: 449-454.
- Palsboll, P. J., M. Bérube & F. W. Allendorf. 2007. Identification of management units using population genetic data. Trends in Ecology and Evolution, 22: 1-16.
- Palumbi, S. R. 1994. Genetic divergence, reproductive isolation, and marine speciation. Annual Review of Ecology and Systematics, 25: 547-572.
- Palumbi, S. R. 2003. Population genetics, demographic connectivity, and the design of marine reserves. Ecological Applications, 13: S146-S158.
- Parker, R. O. Jr. 1990. Tagging studies and diver observations of fish populations on live-bottom reefs of the U.S. southeastern coast. Bulletin of Marine Science, 46: 749-760.
- Parsons, K. J., B. W. Robinson & T. Hrbek. 2003. Getting into shape: an empirical comparison of traditional trussbased morphometric methods with a newer geometric method applied to New World cichlids. Environmental Biology of Fishes, 67: 417-431.
- Peakall, R. & P. E. Smouse. 2006. GENALEX 6: genetic analysis in Excel. Population genetic software for teaching and research. Molecular Ecology Notes, 6: 288-295.
- Pereira, A. N., A. Márquez, M. Marin & Y. Marin. 2009. Genetic evidence of two stocks of the white mouth croaker Micropogonias furnieri in the Río de la Plata and oceanic front in Uruguay. Journal of Fish Biology, 75: 321-331.
- Piola A. R. & R. P. Matano. 2001. Brazil and Falklands (Malvinas) currents. Pp. 340-349. In: Steele, J. H., S. A. Thorpe & K. K. Turekian (Eds.). Encyclopedia of ocean sciences. San Diego, Academic Press.
- Piola A. R. & A. L. Rivas. 1997. Corrientes en la plataforma continental. El Mar Argentino y sus recursos pesqueros, 1: 119-132.
- Pritchard, J. K., M. Stephens & P. Donnelly. 2000. Inference of population structure using multilocus genotype data. Genetics, 155: 945-959.
- Richtsmeier, J. T., V. B. Deleon & S. R. Lele. 2002. The promise of geometric morphometrics. Yearbook of Physical Anthropology, 45: 63-91.
- Rohlf, F. J. 1994. TPSRW: thin-plate spline relative warp analysis. Stony Brook, N. Y. , Department of Ecology and Evolution, State University of New York at, Stony Brook.
- Rohlf, F. J. & L. F. Marcus. 1993. A revolution in morphometrics. Trends in Ecology and Evolution, 8: 129-132.
- Sabadin, D. E., M. González-Castro, C. Iudica, J. M. Diáz de Astarboa & P. J. Fernández-Iriarte. 2010. Morphometric and genetic assessment of the Cynoscion guatucupa population structure from Buenos Aires coast, Argentine Sea. Revista de Biología Marina y Oceanografía, 45: 513-517.
- Sambrook, J., E. F. Fritsch & T. Maniatis. 1989. Molecular cloning: a laboratory manual, 2nd. ed. New York, Cold Spring Harbor Laborator Press. v.1.
- Sumpton, W. D., J. R. Ovenden, C. P. Keenan & R. Street. 2008. Evidence for a stock discontinuity of snapper (Pagrus auratus) on the east coast of Australia. Fisheries Research, 94: 92-98.
- Swain, D. P., J. A. Hutchings & C. J. Foote. 2005. Environmental and genetic influences on stock identification characters. Pp. 45-85. In: Cadrin, S. X., K. D. Friedland & J. R. Waldman. (Eds.). Stock identification methods: applications in fishery science. Burlington, MA, Elsevier Academic Press.
- Waldman, J. R. 2005. Definition of stocks: An evolving concept. Pp. 7-16. In: Cadrin, S. X., K. D. Friedland & J. R. Waldman (Eds.). Stock Identification Methods: Applications in fishery science. Burlington, MA, Elsevier Academic Press.
- Waples, R. S. 1998. Separating the wheat from the chaff: patterns of genetic differentiation in high gene flow species. Journal of Heredity, 89: 438-450.
- Wright, S. 1949. The genetical structure of populations. Annals of Eugenics, 15: 323-354.
Publication Dates
-
Publication in this collection
Apr-Jun 2015
History
-
Received
02 Oct 2014 -
Accepted
15 Feb 2015